Chapter 3 Sequencing and analysis of the nirS gene from Thiosphaera pantotropha

3.1 Introduction

To date the primary sequences of six cytochrome cd\(_1\) proteins, obtained by DNA sequencing of the nirS gene, have been published. These are from the organisms Ps. aeruginosa NTCC 6750 [134], Ps. stutzeri JM300 [139], Ps. stutzeri Zobell [138], P. denitrificans PD1222 [141], P. denitrificans IFO 12442 [140] and A. eutrophus H16 [142]. Additionally, small lengths of peptide sequence have been determined from several cytochromes cd\(_1\) as a result of either N-terminal or internal protein sequencing, e.g. from Pseudomonas stutzeri JM300 [253] and Thiobacillus denitrificans [254]. The initial aim of the present work, the sequencing of the structural gene for cytochrome cd\(_1\) (nirS) from T. pantotropha, was important for several reasons. First, the published crystal structure of the enzyme was determined from the electron density map using comparison to the sequence of the protein from P. denitrificans PD1222 [127]. Although this procedure fitted the diffraction data well, the authentic protein sequence was required to resolve any ambiguities, for instance in the N-terminus of the protein which was disordered in the crystal structure, and to refine the structure. Second, knowledge of the nirS nucleotide sequence was essential for future work involving manipulation of the gene; for example restriction mapping, cloning procedures and mutagenesis. Mapping of the regions either side of the nirS gene would also facilitate cloning and allow comparison of the nir region in T. pantotropha to the closely-related P. denitrificans PD1222. Third, knowledge of the cytochrome cd\(_1\) peptide sequence allows comparison with other cytochromes cd\(_1\) and analysis of the similarities and differences within this group of enzymes.

This chapter describes the strategy used to sequence the nirS gene from T. pantotropha. The DNA sequence is reported and analysed, including comparison with the sequences from two strains of P. denitrificans. The translated cytochrome cd\(_1\) sequence is reported and compared with other known cytochrome cd\(_1\) sequences, using several computer-based methods. This work reveals that there are important differences between the proteins and the comparison with cytochrome cd\(_1\) from Ps. stutzeri Zobell is explored in more detail.

Finally the relationship between the proposed haem ligands and the mechanism of cytochrome cd\(_1\) is discussed, in the light of recent spectroscopic and crystallographic data.

3.2 Sequencing strategy

The nirS gene from T. pantotropha was sequenced in collaboration with Dr. Simon Baker, from a series of overlapping PCR products. Initial studies begun before the present project by Dr. Simon Baker had generated a PCR product using degenerate primers that were designed using short lengths of peptide sequence obtained from T. pantotropha cytochrome cd\(_1\) [240]. The sequence of the PCR product indicated that the nirS DNA sequence of T. pantotropha was very similar to that from P. denitrificans PD1222, and so further primers for PCR and sequencing were designed using the sequence of the nirS gene from P. denitrificans PD1222 [141]. Table 3.1 summarises the primers used.

Table 3.1: Primers used to sequence the nirS gene from T. pantotropha. The equivalent positions in the GenBank sequence accession number U05002 (the sequence of the genes nirI, nirS, nirE, nirC and nirF from P. denitrificans PD1222) are shown. Primer sequences are in the 5’ to 3’ direction for both forward and reverse primers.
Primer direction Primer name Equivalent bases in P. denitrificans nirS sequence(GenBank U05002) Sequence (5’-3’)
Forward 460F 473-492 ACCTCGGCCTTAACAAAGGT
610F 610-629 CTGGCCCTTGTCCTTGGGCC
MIDF 913-932 GGCTTCGACTACCTGCAAAG
1053F 1053-1072 ATTCGGCATGAAGGAGATGCGC
1000F 1192-1211 GACGGCACCACCTATGAGAT
CT2F 1346-1364 CCGAGATCAAGATCGGCTC
CTIF 1352-1369 TCAAGATCGGCTCGGAAG
1572F 1572-1590 GCCCGAGTTCATCGTGAAC
1631F 1630-1650 GACCTCAAGAACCTCAAGACC
1918F 1918-1940 CCCGACAATGCCTGGAAGATCCT
Reverse 228R 756-737 TACGTCCTGCTGTGCAAGGT
242R 714-697 GTTGTCCGTCTTGGTCTT
284R 700-682 TCTTGTGATCCTCGAGTG
811R 810-790 GTTGTATTGGGCGTCGGACAG
460R 932-913 CTTTGCAGGTAGTCGAAGCC
1073R 1072-1051 GCATCTCCTTCATGCCGAATTC
300R 1211-1192 ATCTCATAGGTGGTGCCGTC
MIDR 1461-1442 GTCCATGATGACGTATTGCG
1572R 1592-1574 ACGTTCACGATGAACTCGG
1661R 1660-1642 CGATCTCGGTGGTCTTGAG
1982R 1982-1964 TTGATGAAGAGCGAGCCACC
CT2R 2266-2248 GTTCGAGGGTCTTGTCGTCC
CTIR 2280-2261 GATGACGTGCTTCAGTTCGA
nirS2R 2444-2427 GTTCGTCACCGTCTTGCC
nirSR 2447-2430 CCCGTTCGTCACCGTCTT

The nirS gene was cloned as four overlapping PCR products, generating the plasmids pAP4. pMID1, pCU2p1 and pNDp1. Figure 3.1 shows the sizes of these four PCR products, the primers used to generate them and their relation to the nirS gene from P. denitrificans PD1222.

PCR products used to sequence the _nirS_ gene of _T. pantotropha_. The _nir_ region of _P. denitrificans_ PD1222 is shown, numbered according to the GenBank sequence U05002. Below is a magnified view of the _P. denitrificans_ PD1222 _nirS_ gene, showing its relationship to the four overlapping PCR products AP4, MID1, CU2p2 and NDp1. The lengths of the PCR products and the primer pairs (Table 3.1) used to generate them are shown.

Figure 3.1: PCR products used to sequence the nirS gene of T. pantotropha. The nir region of P. denitrificans PD1222 is shown, numbered according to the GenBank sequence U05002. Below is a magnified view of the P. denitrificans PD1222 nirS gene, showing its relationship to the four overlapping PCR products AP4, MID1, CU2p2 and NDp1. The lengths of the PCR products and the primer pairs (Table 3.1) used to generate them are shown.

Three different clones of each product were used for sequencing, and each clone was sequenced at least twice in both directions. This procedure resolved any ambiguities at each base. Additional sequence information from a genomic clone (plasmid pTNIR3, described in Chapter 4) is completely consistent with the sequence derived from these PCR products.

3.3 Results

Altogether, 2008 bp of DNA sequence was obtained, including that from the plasmid pTNIR3 (which contributed 139 bp of upstream sequence, Chapters 4 and 7). This covers the nirS open reading frame (bases 139-1926) and short flanking regions at the 5’ and 3’ ends. The complete DNA sequence is presented in Figure 3.2, with the translated cytochrome cd\(_1\) polypeptide sequence aligned below. Also indicated in this figure are features of interest within the non-coding regions of the DNA.

Sequence of the _nirS_ gene and its product, cytochrome _cd_$_1$, from _T. pantotropha_. The ATG start codons of open reading frames are labelled with the gene name and an arrow indicating the direction of transcription. Inverted repeats in the DNA sequence are shown by inward facing pairs of arrows. Putative Shine-Delgarno ribosome binding sites are dash-underlined. The _c_-haem binding site in cytochrome _cd_$_1$ is single-underlined. The putative NNR binding site upstream of _nirS_ is boxed. The vertical downward-facing arrow indicates the predicted cleavage site of the periplasmic targeting sequence.

Figure 3.2: Sequence of the nirS gene and its product, cytochrome cd\(_1\), from T. pantotropha. The ATG start codons of open reading frames are labelled with the gene name and an arrow indicating the direction of transcription. Inverted repeats in the DNA sequence are shown by inward facing pairs of arrows. Putative Shine-Delgarno ribosome binding sites are dash-underlined. The c-haem binding site in cytochrome cd\(_1\) is single-underlined. The putative NNR binding site upstream of nirS is boxed. The vertical downward-facing arrow indicates the predicted cleavage site of the periplasmic targeting sequence.

3.3.1 DNA sequence features

Three imperfect inverted repeats are prominent in the DNA sequence, at positions 58-79, 1937-1946 and 1951-1968, and one perfect inverted repeat is found at positions 80-89. Similar repeats are found in the sequences from P. denitrificans PD1222 [141] and P. denitrificans IFO 12442 [140]. The positions, sequences and previously assigned functions of these repeats are summarised in Table 3.2.

Table 3.2: Comparison of inverted repeats in the DNA sequence of the nir region from T. pantotropha with those in the same region of P. denitrificans PD1222. The sequences are numbered according to the GenBank accession numbers U75413 (T. pantotropha) and U05002 (P. denitrificans PD1222). Previously assigned functions of the repeats in the P. denitrificans PD1222 sequence are taken from the GenBank sequence annotation and from de Boer et al. (1994) [141].
DNA sequence of repeat in T. pantotropha DNA sequence of repeat in P. denitrificans PD1222 Previously assigned function of repeat
Repeat 1: 58-79
5’-GGCCTTAACAATGGTCAAAGCC-3’
478-499
5’-GGCCTTAACAAAGTCAAAGCC-3’
Binding site for NNR, an anaerobic transcriptional activator protein of the FNR family
Repeat 2: 80-89
5’-TTGCGCGCAA-3’
500-509
5’-CCGCGCGCGG-3’
No function assigned
Repeat 3: 1937-1946
5’-GGTTACGGACC-3’
2357-2366
5’-GGTTGCAACC-3’
No function assigned
Repeat 4: 1952-1969
5’-GGGGGCGTTCGCGCCCCC-3’
2372-2389
5’-GGGGGCGTTCGCGCCCCC-3’
Repeat structure assigned as binding site for an oxygen responsive element (ORE). 5’ GGGGGC assigned as a -10 RNA polymerase binding site

Two partial open reading frames can be identified in the T. pantotropha DNA sequence (Figure 3.2). The first of these begins at position 17 and reads in the opposite orientation to the nirS gene. The first four amino acids are Met-Ala-Met-Arg. This appears to correspond to the start of the nirI gene (Section 3.4.1), which in P. denitrificans PD1222 begins Met-Ala-Met-Gly [141]. The second ORF at position 2001 begins Met-Ala-Gly; this seems to be the start of the nirE gene (Section 3.4.1), which begins with an identical sequence in P.denitrificans PD1222 [141]. The nirS genes of T. pantotropha and P. denitrificans PD1222 are 94.1% identical and the GC content of the nirS gene is 64%.

3.3.2 Primary sequence of cytochrome cd\(_1\) from T. pantotropha

The nirS gene codes for a protein of 596 amino acids, the first 29 of which are predicted to be a cleavable periplasmic targeting sequence (see Discussion, Section 3.4.3 and Figure 3.3). The six previously published cytochrome cd\(_1\) sequences were downloaded from the GenBank and Swissprot databases and processed using the program SignalP, which predicts targeting sequences according to the rules developed by von Heijne [255] and uses algorithms specifically tested on protein sequences from Gram-negative bacteria [256]. The sequences were edited to remove the predicted targeting sequence and aligned using the ClustalW program [191]. The multiple sequence alignment was then formatted using the program ALSCRIPT [257] to generate Figure 3.4. In this figure, identity between four or more of the sequences is indicated by black shading and similarity is indicated by various grades of grey shading, using amino acid similarity groups based on physicochemical properties. Other shadings are described in the figure legend.

Predicted cleavage site of the periplasmic targeting sequence in cytochrome _cd_$_1$ from _T. pantotropha_. The SignalP program (Nielsen _et al_., 1997 [@nielsen_identification_1997]) predicts the cleavage site on the basis of three scores, termed C, S and Y. The residue lying immediately after the cleavage site has high C and Y scores and a sharp gradient in the S score. In the above figure it can be seen that the residue Q30 is predicted to be this residue. As described in the text, an N-terminal glutamine as the first residue of the mature protein is fully consistent with experimental data.

Figure 3.3: Predicted cleavage site of the periplasmic targeting sequence in cytochrome cd\(_1\) from T. pantotropha. The SignalP program (Nielsen et al., 1997 [256]) predicts the cleavage site on the basis of three scores, termed C, S and Y. The residue lying immediately after the cleavage site has high C and Y scores and a sharp gradient in the S score. In the above figure it can be seen that the residue Q30 is predicted to be this residue. As described in the text, an N-terminal glutamine as the first residue of the mature protein is fully consistent with experimental data.

Multiple alignment of cytochrome _cd_$_1$ sequences. Six previously published cytochrome _cd_$_1$ sequences (see main text for details) were downloaded from the GenBank and SwissProt databases. The sequence of cytochrome _cd_$_1$ from _T. pantotropha_ was added to the group. All sequences were edited to remove the predicted periplasmic targeting sequence and aligned using the Program ClustalW [@thompson_clustal_1994]. The multiple alignment was then processed using the program ALSCRIPT [@barton_alscript_1993], to shade homologous regions and other features of interest. Identity within four or more sequences is indicated by black shading; similarity is indicated by levels of grey shading based on the physicochemical properties of the amino acids. Conserved methionine and histidine residues which could be potential haem ligands are indicated in white on dark-grey and conserved aspartate residues at the end of the third strand in each $\beta$ propeller (see Appendix A) are shown in white on light-grey. The haem ligands His-17, His-69 (_c_-haem), His-200 and Tyr-25 (_d_$_1$ haem) in the oxidised _T. pantotropha_ enzyme are shown by open boxes. The secondary structure elements of the _T. pantotropha_ enzyme  [@fulop_anatomy_1995] are shown above the alignment. Abbreviations: tp9263, _T. pantotropha_ LMD 92.63; pd1222, _P. denitrificans_ PD1222; pd12442, _P. denitrificans_ IFO 12442; pss14405, _Ps. stutzeri_ Zobell; pss300, _Ps. stutzeri_ JM300; psa6750, _Ps. aeruginosa_ NTCC 6750; aeh16, _A. eutrophus_ H16.

Figure 3.4: Multiple alignment of cytochrome cd\(_1\) sequences. Six previously published cytochrome cd\(_1\) sequences (see main text for details) were downloaded from the GenBank and SwissProt databases. The sequence of cytochrome cd\(_1\) from T. pantotropha was added to the group. All sequences were edited to remove the predicted periplasmic targeting sequence and aligned using the Program ClustalW [191]. The multiple alignment was then processed using the program ALSCRIPT [257], to shade homologous regions and other features of interest. Identity within four or more sequences is indicated by black shading; similarity is indicated by levels of grey shading based on the physicochemical properties of the amino acids. Conserved methionine and histidine residues which could be potential haem ligands are indicated in white on dark-grey and conserved aspartate residues at the end of the third strand in each \(\beta\) propeller (see Appendix A) are shown in white on light-grey. The haem ligands His-17, His-69 (c-haem), His-200 and Tyr-25 (d\(_1\) haem) in the oxidised T. pantotropha enzyme are shown by open boxes. The secondary structure elements of the T. pantotropha enzyme [127] are shown above the alignment. Abbreviations: tp9263, T. pantotropha LMD 92.63; pd1222, P. denitrificans PD1222; pd12442, P. denitrificans IFO 12442; pss14405, Ps. stutzeri Zobell; pss300, Ps. stutzeri JM300; psa6750, Ps. aeruginosa NTCC 6750; aeh16, A. eutrophus H16.

The multiple sequence file was processed using three other computational methods in order to compare the seven sequences. Each cytochrome cd\(_1\) sequence was compared to the other six using the GCG program BESTFIT [248]. This program generates a percentage identity and similarity for each pair, the results of which are summarised in Table 3.3.

Table 3.3: Matrix of similarities and identities between the cytochromes cd\(_1\).Pairwise comparisons were determined using the program BESTFIT, part of the GCG 8.0 package. In each box the upper bold figure is the percentage similarity for the pair, the lower is percentage identity. Sequence abbreviations are: Tp9263, T. pantotropha LMD 92.63, Pd1222, P. denitrificans PD1222, Pd12442, P. denitrificans IFO 12442, Pss14405, Ps. stutzeri ATCC 14405, Pss300, Ps. stutzeri JM300, Psa6750, Ps. aeruginosa NTCC 6750, AeH16, A. eutrophus H16.
Pd1222 97.8
97.1
Pd12442 95.0
91.6
96.7
94.0
Pss14405 73.5
55.0
78.5
66.1
73.7
55.4
Pss300 71.8
53.8
72.4
54.4
71.6
52.7
93.7
89.2
Psa6750 78.5
65.8
78.5
66.1
77.5
64.1
75.2
58.9
73.7
57.2
AeH16 78.6
61.8
78.8
62.4
77.6
60.8
74.1
59.2
73.2
59.2
80.3
65.5
Tp9263 Pd1222 Pd12442 Pss14405 Pss300 Psa6750

Phylogenetic relationships between the aligned sequences were inferred using ClustalW. To generate the unrooted phylogram shown in Figure 3.5a, the multiple alignment was processed using a neighbour-joining method [192] to calculate divergence distance between the sequences. The statistical significance of the tree was analysed by the method of bootstrapping [193] with 1000 trials and the output was visualised with the program TreeView [194]. Figure 3.5b is a phylogenetic tree inferred from 16S ribosomal RNA sequences and used for comparison with the protein sequence tree.

Phylogenetic tree of cytochrome _cd_$_1$ sequences compared with a phylogenetic tree of 16S rRNA sequences from the same organisms. (a) The sequences were aligned using the ClustalW program and the tree was calculated using the neighbour-joining method of Saitou and Nei [@saitou_neighbor-joining_1987]. The tree was then analysed using the method of bootstrapping, with 1000 trials and visualised with the program TreeView. Sequence abbreviations are as in Table 3.3. (b) The 16S rRNA tree was calculated in the same way as for the cytochromes _cd_$_1$, except that gaps were ignored due to the partial nature of the _T. pantotropha_ LMD 92.63 and _P. denitrificans_ PD1222 sequences (obtained from Dr. D.J. Richardson, University of East Anglia). Complete 16S rRNA gene sequences for _Ps. stutzeri_ ATCC 14405, _Ps. stutzeri_ JM300, _Ps. aeruginosa_ DSM 50071 (Psa50071) and _P. denitrificans_ LMG 4218 (Pd4218) were taken from the GenBank database.

Figure 3.5: Phylogenetic tree of cytochrome cd\(_1\) sequences compared with a phylogenetic tree of 16S rRNA sequences from the same organisms. (a) The sequences were aligned using the ClustalW program and the tree was calculated using the neighbour-joining method of Saitou and Nei [192]. The tree was then analysed using the method of bootstrapping, with 1000 trials and visualised with the program TreeView. Sequence abbreviations are as in Table 3.3. (b) The 16S rRNA tree was calculated in the same way as for the cytochromes cd\(_1\), except that gaps were ignored due to the partial nature of the T. pantotropha LMD 92.63 and P. denitrificans PD1222 sequences (obtained from Dr. D.J. Richardson, University of East Anglia). Complete 16S rRNA gene sequences for Ps. stutzeri ATCC 14405, Ps. stutzeri JM300, Ps. aeruginosa DSM 50071 (Psa50071) and P. denitrificans LMG 4218 (Pd4218) were taken from the GenBank database.

Complete or partial rRNA sequence is known for four of the organisms under study as indicated in the figure legend; a different strain of Ps. aeruginosa and a third P. denitrificans strain were added to this group for comparison. The incomplete 16S rRNA sequences of P. denitrificans PD1222 and T. pantotropha were obtained from Dr. D.J. Richardson, University of East Anglia (J.P. Carter, S. Spiro and D.J. Richardson, unpublished results). The tree was produced in a similar manner to that for the cytochrome cd\(_1\) sequences, except that gaps in the alignment were ignored owing to the partial nature of some of the 16S rRNA sequences. Finally the amino acid composition, molecular weight and predicted isoelectric point of each sequence was analysed using the program ProtParam [258]. These data are presented in Table 3.4.

Table 3.4: Comparison of the physicochemical properties of cytochrome cd\(_1\) from different sources. Sequence abbreviations are as in Table 3.3 and Figure 3.4. Cytochrome cd\(_1\) sequences were retrieved from the GenBank and SwissProt databases. The data presented in the table was obtained using the program ProtParam [258].
Sequence ID Tp9263 Pd1222 Pd12442 Ps14405 Ps300 Pa6750 Aeh16
Length 567 568 568 534 527 543 529
Molecular weight (Da) 62 538.9 62 596.1 62 687.5 59 532.7 58 862.8 60 178.2 58 000.0
Theoretical pI 4.75 4.73 5.02 6.44 6.59 7.39 8.44
Amino acid (%)
Ala 8.8 9.3 9.3 7.3 8.0 7.9 9.8
Arg 3.7 3.5 4.0 3.6 4.4 4.2 4.3
Asn 3.7 3.7 4.0 4.3 4.2 3.7 3.4
Asp 7.8 7.6 6.9 6.4 6.8 7.0 7.4
Cys 0.4 0.4 0.5 0.4 0.4 0.4 0.4
Gln 3.2 3.3 3.2 2.4 2.3 4.2 2.3
Glu 7.6 7.7 7.2 6.6 6.3 5.0 4.5
Gly 8.3 8.5 8.5 7.5 7.0 7.7 7.9
His 2.5 2.5 2.5 2.6 2.7 2.9 2.5
Ile 5.1 5.3 5.5 5.8 5.9 5.5 5.5
Leu 7.6 7.6 7.4 6.4 6.1 6.8 7.6
Lys 5.5 5.5 5.6 8.6 8.2 7.7 8.1
Met 2.1 2.5 2.3 2.6 2.8 2.0 1.7
Phe 3.2 3.2 3.2 2.6 2.7 2.6 2.6
Pro 6.0 6.0 6.3 5.2 5.5 6.3 6.0
Ser 5.1 4.8 4.6 5.6 5.5 6.4 5.1
Thr 7.4 7.0 7.0 7.3 7.8 5.7 7.4
Trp 1.9 1.9 1.9 2.2 2.5 2.0 1.7
Tyr 3.7 3.7 3.9 3.9 3.4 3.7 4.0
Val 6.5 6.2 6.2 8.6 7.8 8.1 8.0

3.4 Discussion

3.4.1 Features of the DNA sequence

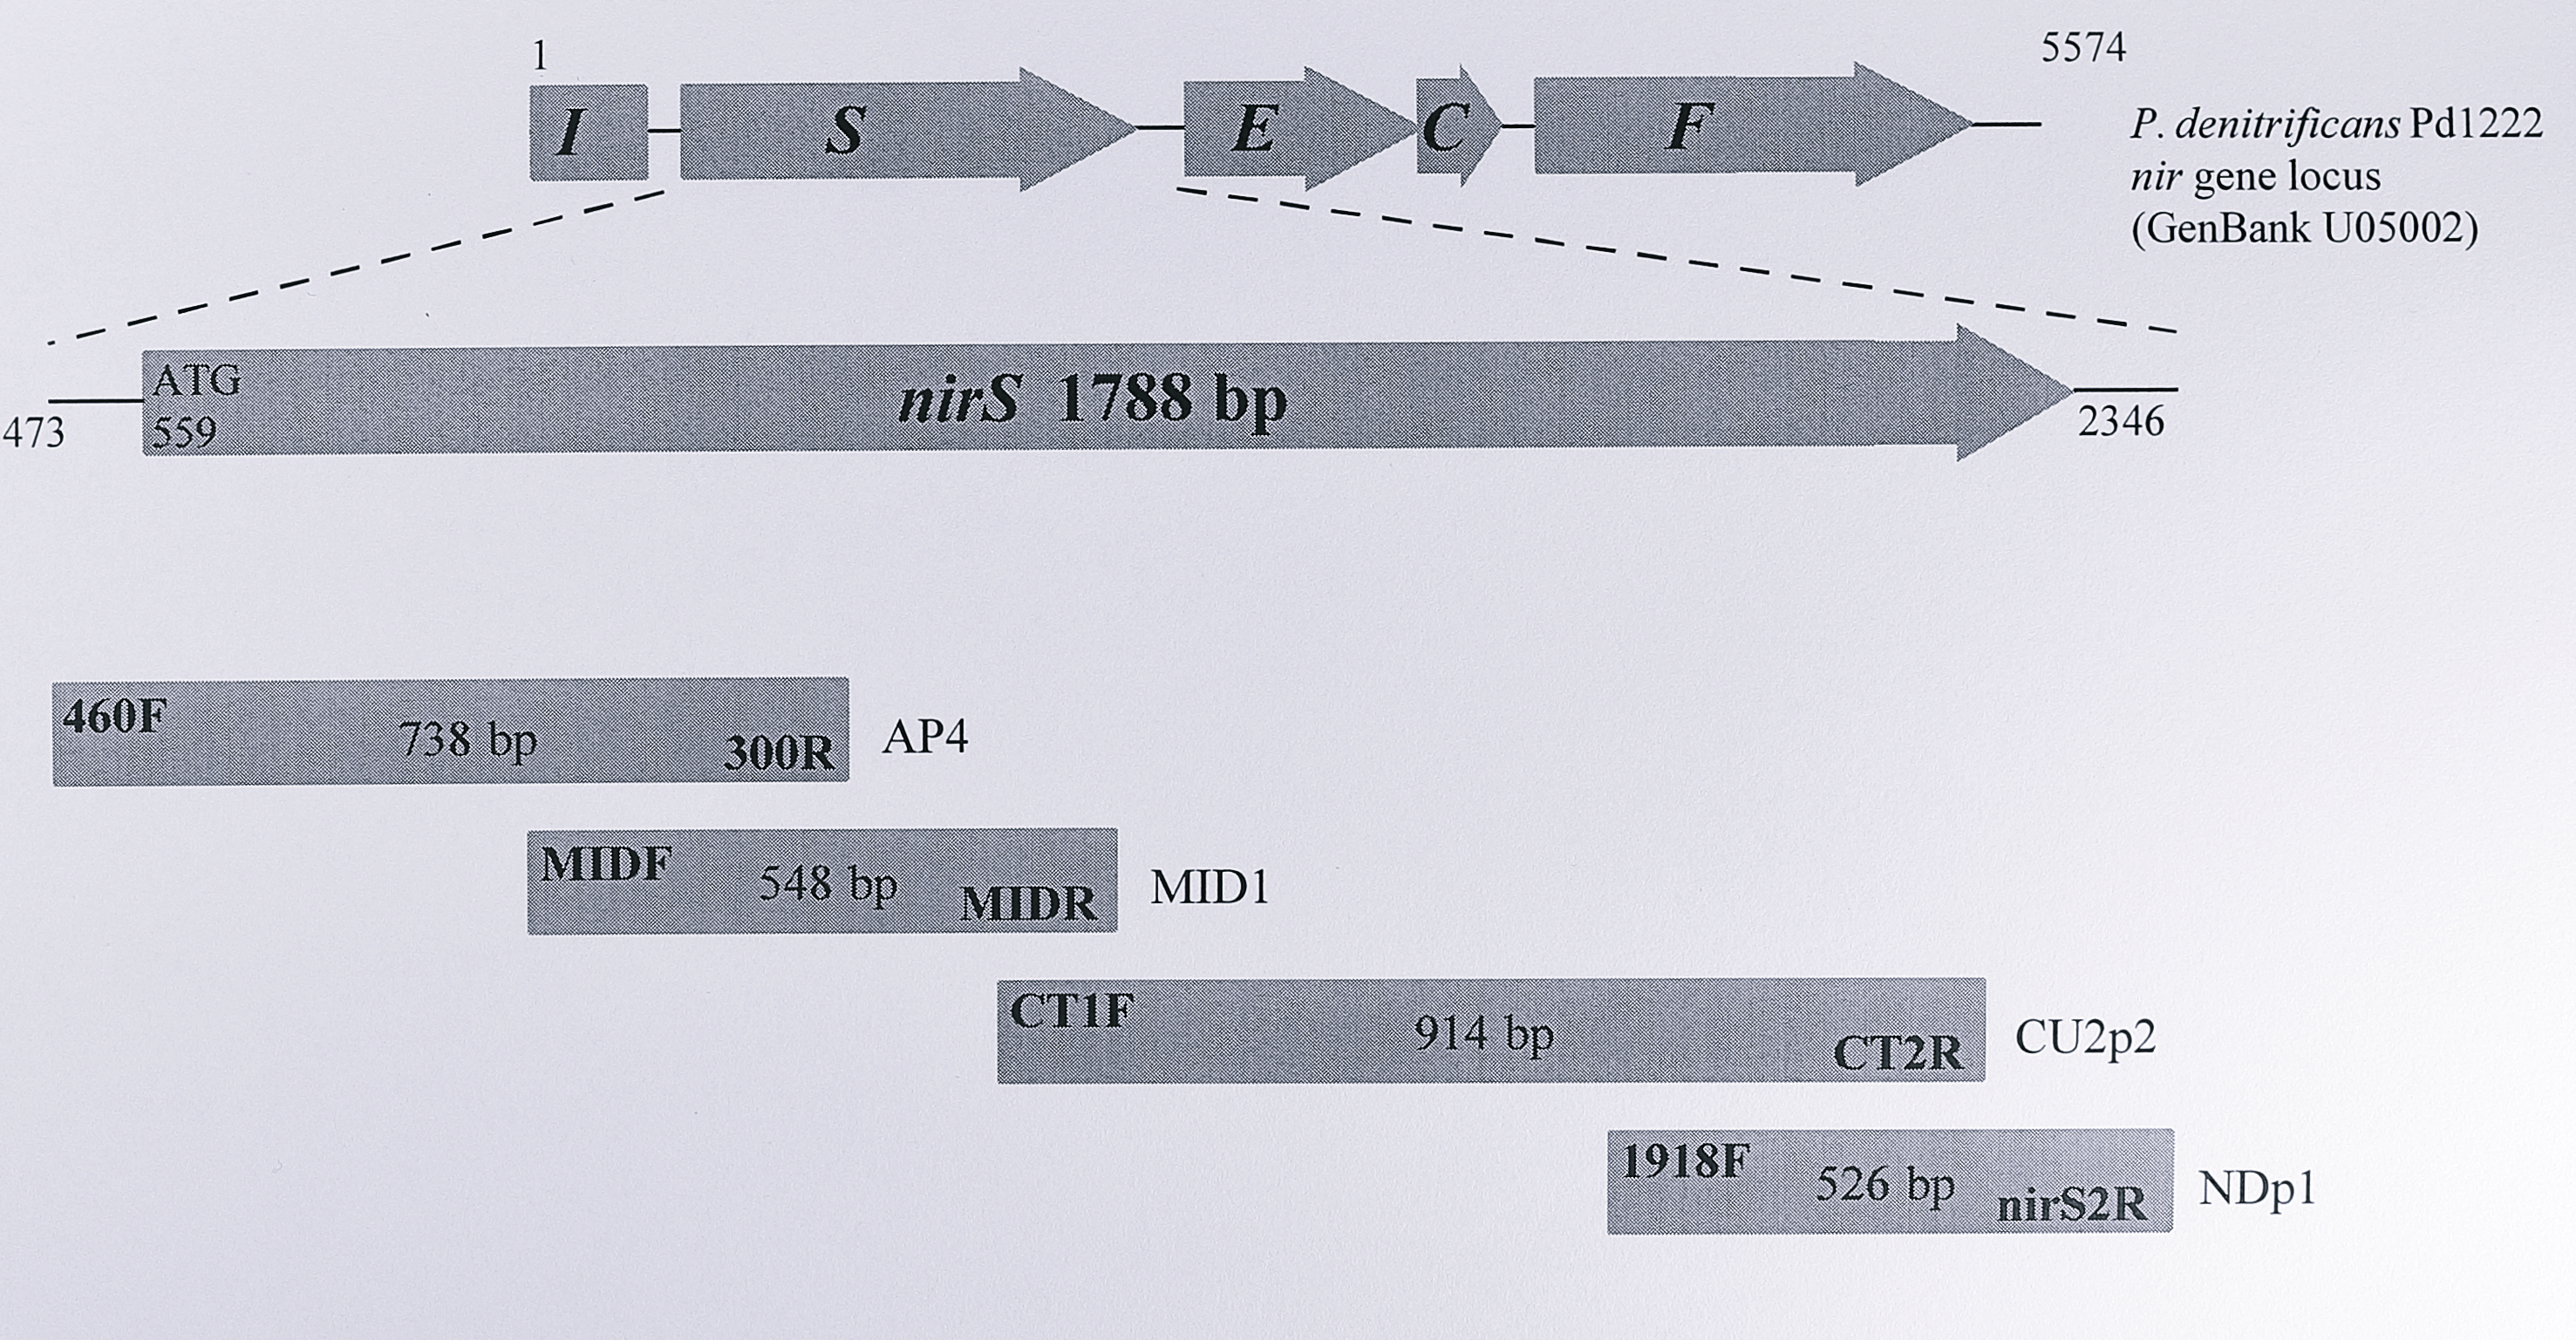
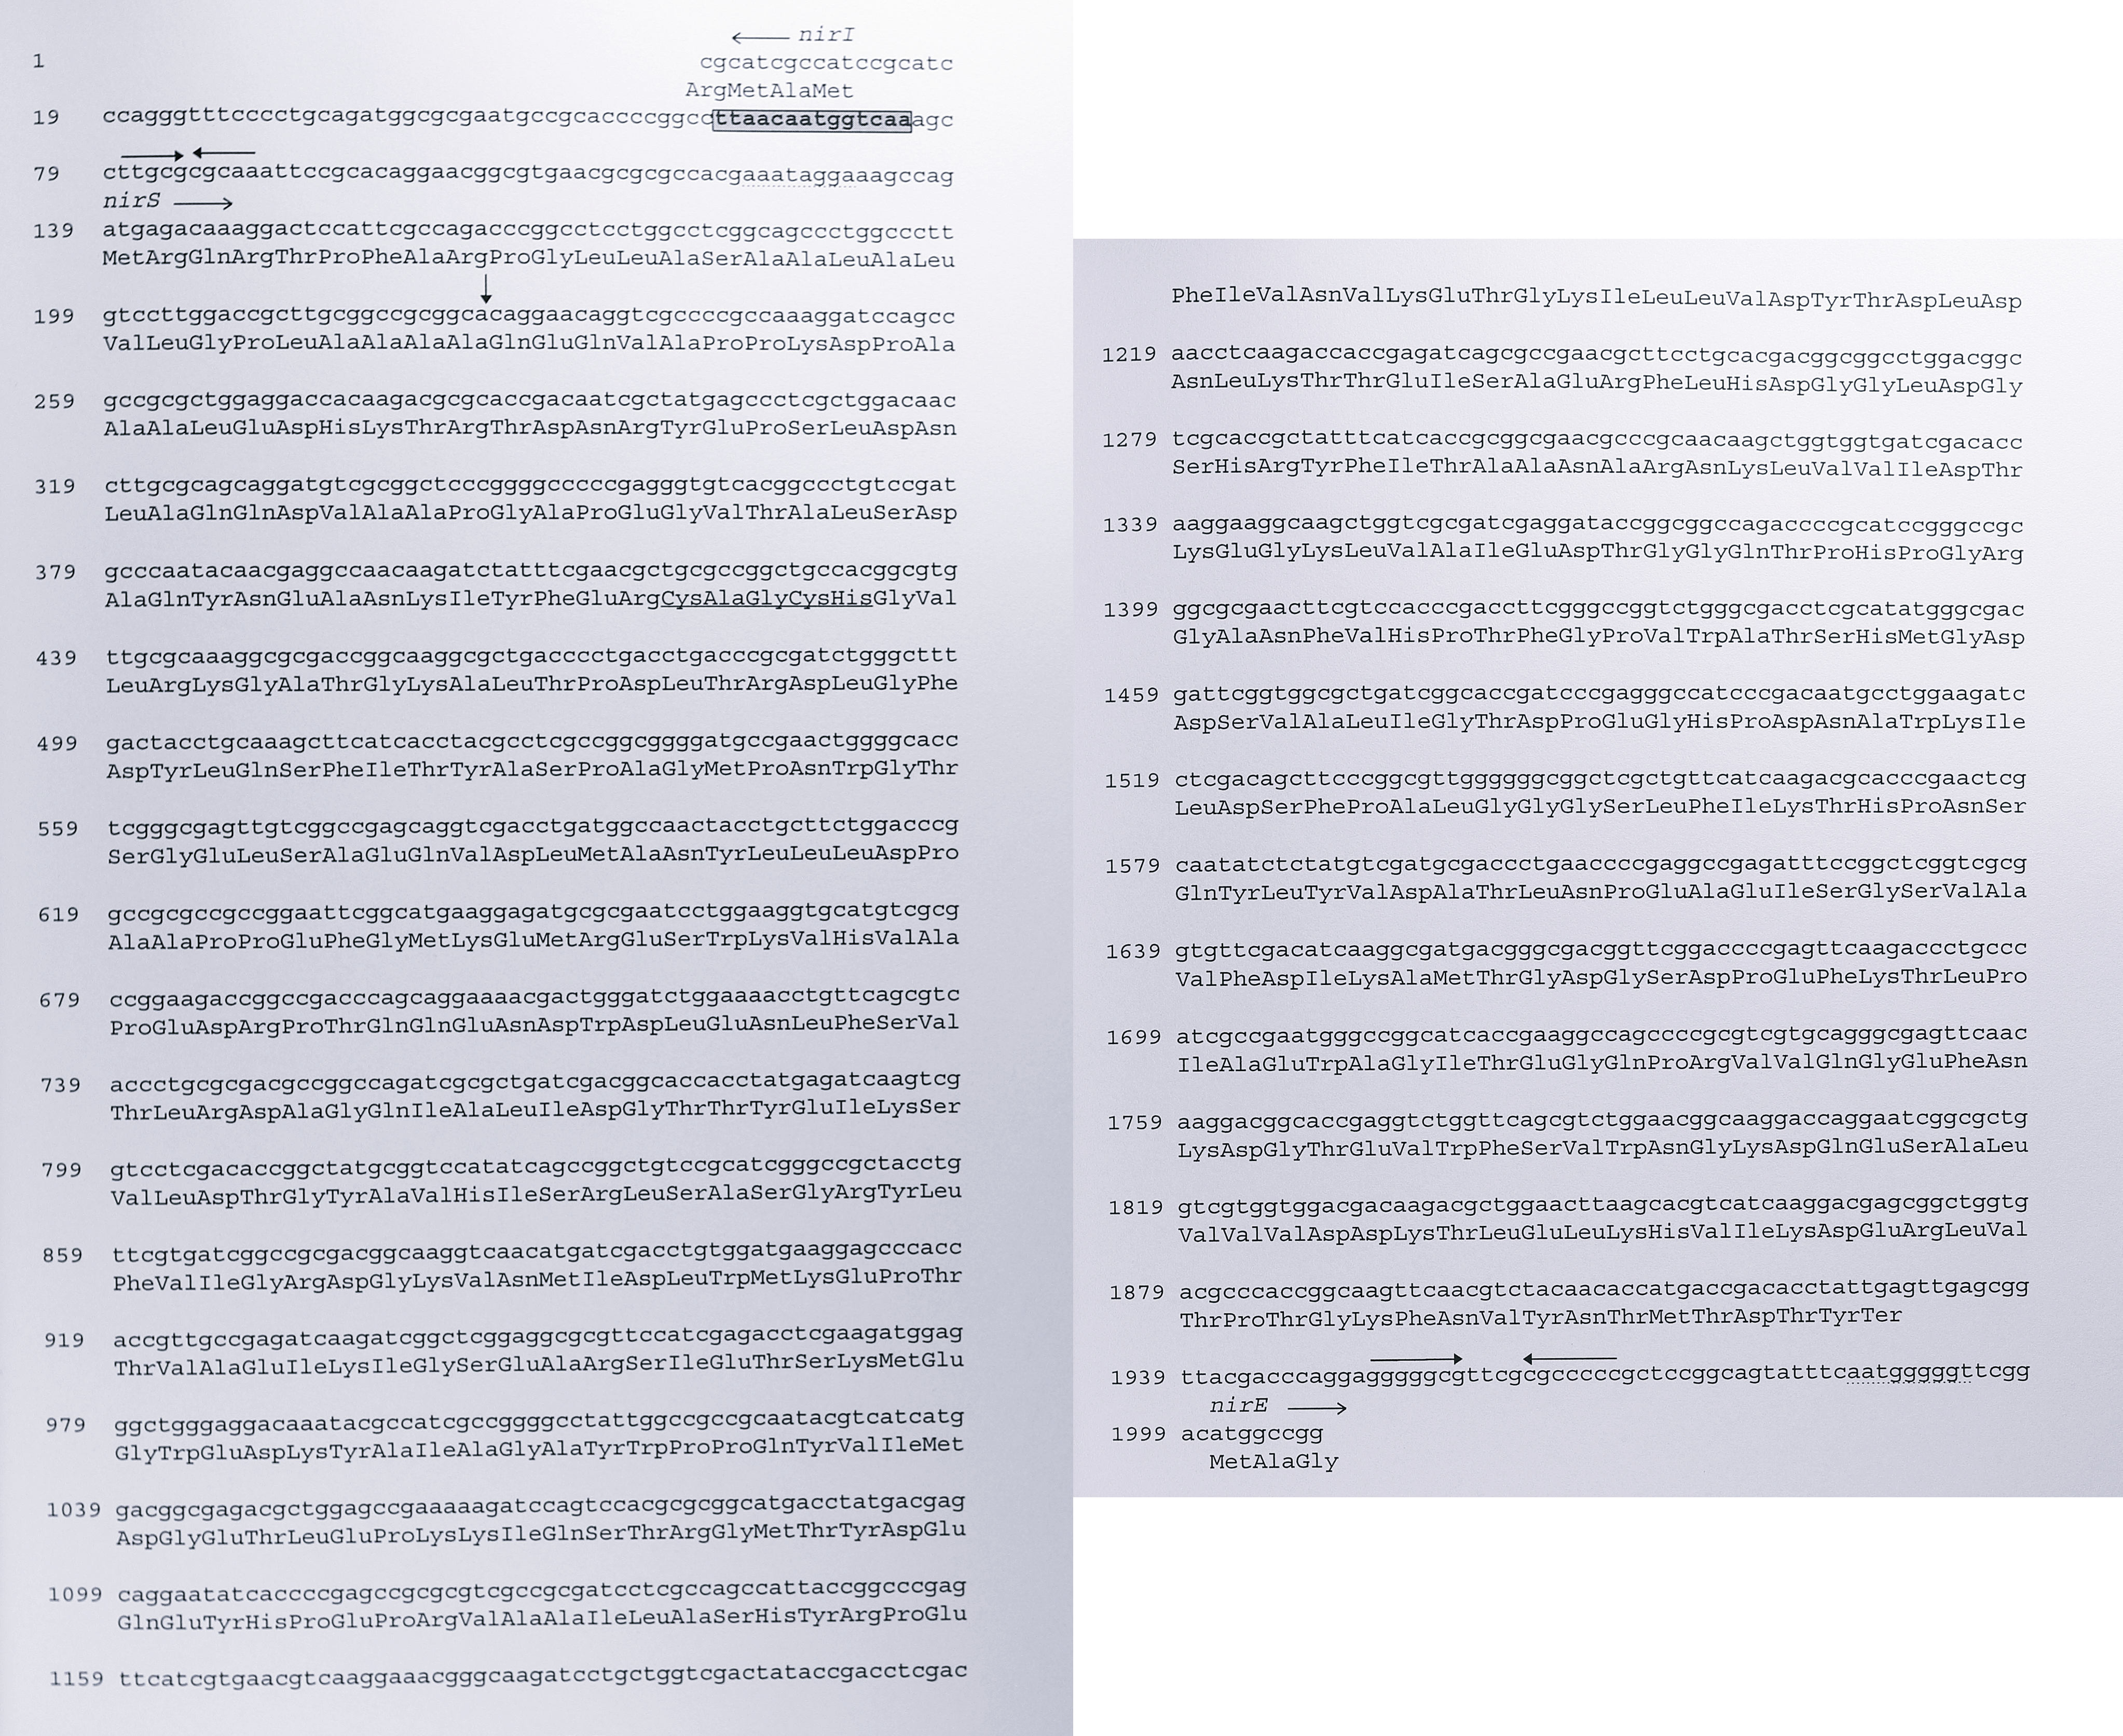
The nirS gene and its immediate flanking regions are very similar in both T. pantotropha and the two previously published P. denitrificans sequences; in particular the nirS open reading frame from T. pantotropha is 94.1% identical to that of P. denitrificans PD1222. The GC content of the two genes is 64%, a typical figure for genes from Paracoccus species, reflecting the high GC content of the genome (68% [259]).

In P. denitrificans PD1222, an open reading frame was identified both upstream and downstream of the nirS gene. The upstream ORF was designated nirI and has some sequence homology to the regulatory protein nosR [96,141], in that it is predicted to be an integral membrane protein with a putative iron-sulphur cluster. It is transcribed divergently from the nirS gene. Insertional mutation in nirI results in the loss of cytochrome cd\(_1\) [141], Chapter 7. The nirI ORF is also present in the sequence from P. denitrificans IFO 12442, although Ohshima et al. (1993) [140] failed to identify it as such. Translation of the first 37 codons from the latter sequence shows 97% identity to the P. denitrificans PD1222 NirI protein, with a substitution of Phe for Leu at position 33. In the T. pantotropha sequence, the start of the nirI gene can also be discerned, with a substitution of Arg for Gly at position 4.

Downstream of nirs, de Boer et al. (1994) [141] identified the gene nirE. The product of this gene shows similarity to a number of S-adenosyl-L-methionine uroporphyrinogen (III) methyltransferases such as the sirohaem biosynthetic gene cysG of E. coli [42], and cobA, a cobalamin biosynthesis gene of S. typhimurium [260], and is thought to be involved in methyl transfer to the isobacteriochlorin ring during the biosynthesis of haem d\(_1\). Insertional inactivation of nirE results in the formation of inactive cytochrome cd\(_1\), lacking the d\(_1\) haem [141]. This open reading frame was identified (but not characterised) in P. denitrificans IFO 12442 [140].

Translation of the first 27 codons from the P. denitrificans IFO 12242 gene shows 81% identity to the P. denitrificans PD1222 NirE product. Once again, the start of the nirE gene can be identified in the T. pantotropha sequence. These sequence data indicate that the structure of the nir gene cluster in the immediate vicinity of nirS is highly conserved in T. pantotropha and the two strains of Paracoccus denitrificans characterised to date. Further mapping of this region, described in Chapter 4, confirms this observation.

The non-coding regions flanking the nirS gene contain a number of inverted repeats which are also quite highly conserved. In the T. pantotropha sequence, the first of these (repeat 1, Table 3.1) begins 81 bp upstream of the nirS initiation codon. In P. denitrificans PD1222 this sequence was identified as containing a putative binding site for NNR, a transcriptional activator protein belonging to the FNR family [188], Chapter 7. The NNR gene has been cloned and sequenced in this organism [197] and insertional mutagenesis results in the loss of nitrite and nitric oxide reductases. The putative NNR binding sequences are very similar, with a single substitution of T for A at position 12 in the T. pantotropha sequence. This lies in the non-conserved region of the NNR box consensus and is unlikely to be important. An identical sequence to the P. denitrificans PD1222 NNR box is found in the P. denitrificans IFO 12442 sequence, although Ohshima et al. (1993) [140] did not identify it as such. Instead, they assigned the TAA trinucleotide as a stop sequence for a putative upstream open reading frame and included part of the NNR box sequence in a larger, downstream repeat. Both of these assignments appear to be erroneous in the light of other data. Expression of cytochrome cd\(_1\) in all three organisms is, therefore, concluded to be transcriptionally regulated by the NNR protein. An alignment of these three NNR boxes with the FNR consensus sequence is shown in Figure 3.6.

Putative NNR binding sites in the upstream regions of the _nirS_ gene aligned with the FNR consensus binding site. The NNR boxes upstream of _nirS_ in _T. pantotropha_ LMD 92.63 (Tp9263), _P. denitrificans_ PD1222 (Pd1222) and _P. denitrificans_ IFO 12442 (Pd12442) are shown as part of a larger inverted repeat, aligned to the consensus FNR binding site derived from anaerobically-regulated _E. coli_ genes [@spiro_fnr_1994].

Figure 3.6: Putative NNR binding sites in the upstream regions of the nirS gene aligned with the FNR consensus binding site. The NNR boxes upstream of nirS in T. pantotropha LMD 92.63 (Tp9263), P. denitrificans PD1222 (Pd1222) and P. denitrificans IFO 12442 (Pd12442) are shown as part of a larger inverted repeat, aligned to the consensus FNR binding site derived from anaerobically-regulated E. coli genes [188].

Immediately downstream of the NNR box is a small, perfect inverted repeat (repeat 2, Table 3.2). This structure is also seen in the two P. denitrificans sequences but interestingly, in both cases, the first and last dinucleotides are substituted by CC and GG respectively. Hence the repeat structure is preserved, although the sequences differ. No putative function has been assigned to this repeat, but its structural conservation implies that it has some importance. A possible function is the binding of a transcriptional repressor protein; this possibility is explored more fully in Chapter 7.

Two more repeat sequences are found between the nirS and nirE genes in T. pantotropha. The first of these (repeat 3, Table 3.2) was identified in the P. denitrificans PD1222 sequence as a perfect 10 bp inverted repeat and is also found in the P. denitrificans IFO 12442 sequence. However, in T. pantotropha the sequence differs at positions five and seven and so is an imperfect repeat. The significance of this repeat is unclear.

Finally, a large imperfect repeat (repeat 4, Table 3.2) is found 6 bp downstream of repeat 3 in T. pantotropha. The sequence of this repeat is perfectly conserved in the P. denitrificans PD1222 sequence, but less so in P. denitrificans IFO 12442 where the corresponding sequence differs at positions one and five. In P. denitrificans PD1222 two assignments were made to this sequence; the first GGGGGC hexanucleotide was suggested to be a putative -10 promoter sequence for the nirE gene [141], based on the promoter consensus for purple non-sulphur bacteria of Steinrücke and Ludwig (1993) [259], whilst the structure as a whole was suggested by the same authors to be a putative oxygen responsive element (ORE). An ORE is a region of dyad symmetry found upstream of genes that are regulated by oxygen; it was first identified in photosynthetic genes from the genus Rhodobacter [261] and is thought to bind a protein that represses transcription under aerobic conditions. Steinrücke and Ludwig (1993) [259] have proposed that some Paracoccus are also ORE-regulated. Both of the assignments proposed by de Boer et al. (1994) [141] were tentative and both now appear unlikely. Based on the finding that nirS is transcribed as a single mRNA species (see Chapter 7 for data and discussion), this feature could be involved in transcriptional termination.

3.4.2 Analysis of the seven primary sequences of cytochromes cd\(_1\)

A ClustalW multiple alignment of the six previously published cytochrome cd\(_1\) sequences plus the T. pantotropha sequence is shown in Figure 3.4. It is clear that as a group, the cytochromes cd\(_1\) are extremely highly conserved. In this alignment identity between four or more sequences is indicated by black shading. A large number of identical regions are apparent, particularly around the c-haem binding region and in the haem d\(_1\) binding domain (which corresponds to residues 135-567 in the mature T. pantotropha sequence). The T. pantotropha enzyme shows most homology to the two P. denitrificans sequences (97.1% identity to P. denitrificans PD1222); of all the pairwise comparisons, the lowest identity is still considerable (52.7% between Ps. stutzeri JM300 and P. denitrificans IFO 12442). However, variation is apparent within the N-terminal region, a point which is returned to presently.

The ClustalW alignment was used as the basis for construction of a phylogenetic tree. To generate this tree, the ClustalW program uses the neighbour-joining method of Saitou and Nei [192]. Briefly, this algorithm compares all pairs of sequences in an alignment and computes a percentage divergence between them. A correction is included to take account of the possibility that multiple mutations can occur at one site. Pairs of sequences are then joined and connected to the other sequences by an internal branch, such that the total branch length is minimised. The joined sequences are merged and the process is repeated, so an alignment of N sequences allows an unrooted tree with N-3 internal branches. To place confidence limits on the tree, the method of bootstrapping [193] was employed. This process is quite complex, but essentially for an alignment of N residues in length, a random sample of N sites is taken, from which a distance matrix and tree can be calculated. This process is repeated a large number of times (1000 is a typical figure) and a site may be selected several times, or not at all, in any given sample. If the sample trees are similar to one another and the tree from the complete data set, the tree is strongly supported. A particular grouping of sequences is considered significant at the 95% confidence level if it occurs in 95% or more of the bootstrap samples. The biological significance of the tree, in terms of phylogenetic relationships will always be a rather subjective judgement, based on factors such as agreement between trees from different data sources (e.g. protein and rRNA sequences) and other taxonomic schemes for grouping organisms.

Figure 3.5a shows that the T. pantotropha sequence lies closest to that from P. denitrificans PD1222 and that these two form a group with P. denitrificans IFO 12442. This group is most distant from the two strains of Ps. stutzeri which group together. The proteins from Ps. aeruginosa and A. eutrophus are approximately equidistant from these two groups and closer to each other than the other enzymes. This grouping is what would be expected from the current consensus opinion of the phylogeny of the Proteobacteria [262]. For comparison, a phylogenetic tree constructed from 16S ribosomal RNA sequences is shown in Figure 3.5b. 16S rRNA sequences are widely used to infer phylogeny (the advantages and limitations of the method are discussed in Fox et al. (1992) [263], and the results agree closely with that obtained from the cytochrome cd\(_1\) sequences. The main results of this analysis can be summarised as follows: (1) comparison of cytochrome cd\(_1\) and 16S rRNA sequences between the organisms under consideration gives estimates of relatedness which agree well with one another and with current ideas about bacterial taxonomy and (2) the high similarity of the cytochrome cd\(_1\) sequences indicates an interspecies transfer of the nirS gene in the evolutionary past and/or a strong relationship between structure and function in the protein.

3.4.3 Relationship of the primary sequence to the structure of cytochrome cd\(_1\)

Sequencing of the nirS gene from T. pantotropha has allowed the crystal structure of the enzyme, originally deduced from electron density by comparison with the P. denitrificans PD1222 sequence [127], to be checked for errors and refined [264]. There were 14 discrepancies between the density map and the P. denitrificans PD1222 sequence in the original publication of the oxidised crystal structure; the translated protein sequence has confirmed 11 of these (three were shown to be the same as the P. denitrificans sequence), as well as revealing four others that were not apparent earlier (counting from the N-terminus of the mature protein these are K2OR, G101A, E339S and A499T, the corrected amino acid second). The oxidised crystal structure has now been determined at the higher resolution of 1.28 \(\unicode{x212b}\) and is fully consistent with the protein sequence presented in this chapter.

The crystal structure of cytochrome cd\(_1\) contains 559 residues, giving a calculated molecular weight of 62 249 Da per monomer including the covalently-bound c haem moiety. The monomeric molecular weight as measured by electrospray mass spectrometry was 63 091 +/- 8 Da [101], a discrepancy of 842 Da (when using the P. denitrificans sequence for comparison). From this, it was argued that eight N-terminal residues of the mature protein in the crystal structure were not visible, due to disorder in the crystal packing [127]. This has been confirmed by sequencing of the nirS gene. The T. pantotropha nirS gene encodes a protein of 596 amino acids, with a calculated molecular weight of 66 045 Da, including the c haem. The first 29 residues are predicted to be a cleavable periplasmic targeting sequence (Figure 3.3), giving a molecular weight for the mature protein of 63 141 Da. The discrepancy between the latter figure and the molecular weight calculated from the crystal structure is 892 Da, which is accounted for by the first eight residues in the mature T. pantotropha sequence. These residues are QEQVAPPK, an additional molecular weight of 896 Da. The N-terminus of cytochrome cd\(_1\) from T. pantotropha is known to be blocked, as it is resistant to Edman degradation [240]. An N-terminal glutamine, as postulated above, can account for this by cyclisation to pyroglutamate. The N-terminus of cytochrome cd\(_1\) from P. denitrificans IFO 12442 has also been reported to be blocked [140]. However, the equivalent eight residue sequence in the two Paracoccus sequences is QEQAAPPK and a further difference (counting from the N-terminus of the uncleaved protein, residue 27 is alanine in the Paracoccus sequences, valine in T. pantotropha) makes the predicted signal cleavage site one residue earlier in both Paracoccus sequences, giving AQEQAAPPK as the mature N-terminus. This would not be expected to show blockage, but in the absence of further experimental data, the predicted mature sequences have been used in this chapter and the effect on the alignment is insignificant.

The crystal structure of cytochrome cd\(_1\) from T. pantotropha showed that the c haem was ligated by His-17 and His-69 (numbering is with the targeting sequence removed) and the d\(_1\) haem by Tyr-25 and His-200 [127]. Both of these arrangements were somewhat unexpected; first, bis-histidyl ligation is normally associated with low-potential haems [151,265], whereas the c-haem in cytochrome cd\(_1\) has a midpoint redox potential of around 243 mV (A. Koppenhöfer, unpublished data). Second, tyrosyl ligation to haem groups, which is most common in bacterial catalases [266] also results in a low redox potential, as illustrated by mutant forms of haemoglobin [267] and myoglobin [268]. The midpoint redox potential of the d\(_1\) haem in cytochrome cd\(_1\) from T. pantotropha is not known but is likely to be a few tens of millivolts lower than that of the c haem (Chapter 1, Table 1.2). However, the protein sequence confirms the presence of all of these residues.

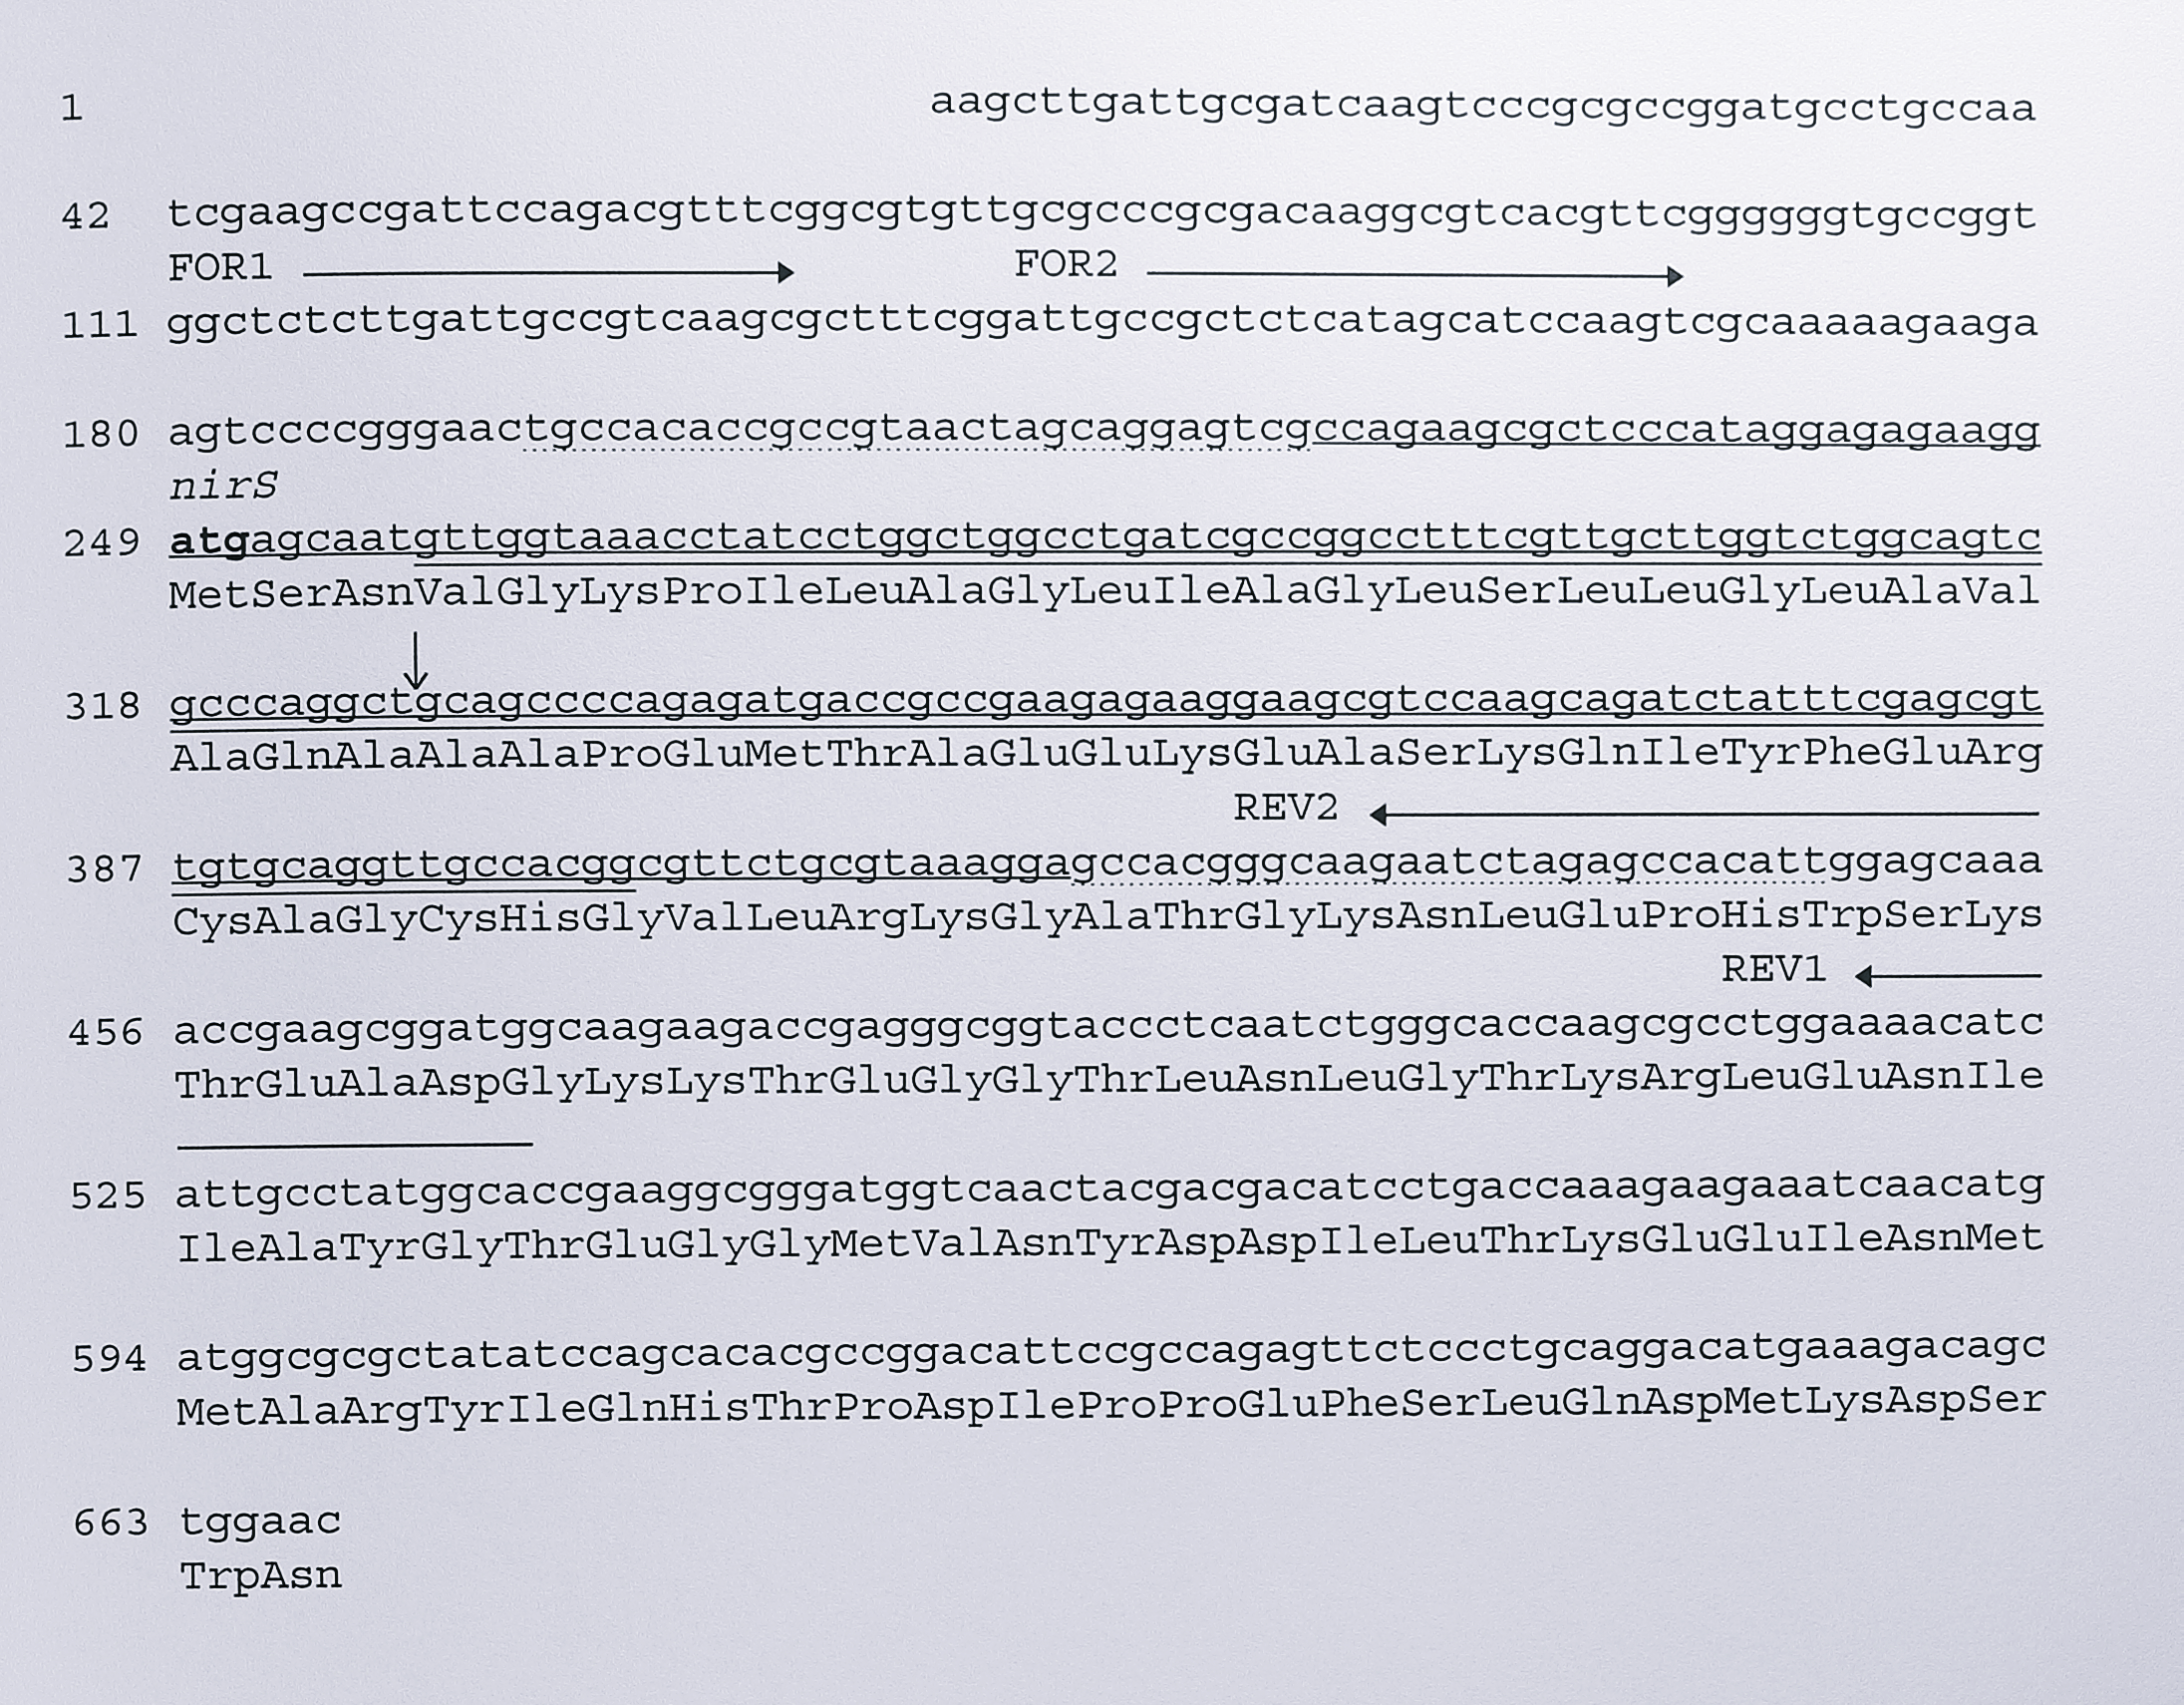
His-17 and Tyr-25 are located towards the N-terminus of the protein, which Figure 3.4 shows to be the least conserved region of the cytochromes cd\(_1\). Intriguingly, inspection of Figure 3.4 shows that these residues are conserved only in T. pantotropha and the two strains of Paracoccus. The other proteins lack the N-terminal extension seen in these sequences which contains the two haem ligands. Of the other proteins, only that from Ps. aeruginosa contains a histidine or tyrosine residue at even roughly similar positions in the N-terminus before the c haem binding site. This finding was extremely unexpected. Ligands to the haem groups control several important factors such as the redox potential, substrate accessibility and the reaction mechanism; in T. pantotropha, Tyr-25 has been postulated to play a crucial role in the release of nitric oxide from the haem group [127]. The importance of these residues and the overall high similarity of the proteins suggests that functional amino acids should be highly conserved. For this reason, it was decided to re-sequence the relevant segment of the nirS sequence from Ps. stutzeri Zobell so as to examine the possibility that the sequence had been mis-reported, or that errors in the sequence (such as base changes or frame shifts) could have resulted in the apparent absence of at least Tyr 25. Two sets of forward and reverse primers, flanking the N-terminal region of the nirS protein, were designed and used to amplify genomic DNA from Ps. stutzeri Zobell, as shown in Figure 3.7.

Early region of the _nirS_ gene from _Ps. stutzeri_ ATCC 14405, showing primers used for re-sequencing and the sequence obtained. The downward arrow indicates a deletion of about 40 amino acids seen when the cytochrome _cd_$_1$ sequence is aligned to that of _T. pantotropha_. Primers designed to flank this region (FOR1, FOR2, REV1 and REV2) are indicated by horizontal arrows. The sequence obtained is annotated as follows; dotted underline = sequenced once in one direction, single underline = sequenced twice in forward direction, double underline = sequenced in both directions.

Figure 3.7: Early region of the nirS gene from Ps. stutzeri ATCC 14405, showing primers used for re-sequencing and the sequence obtained. The downward arrow indicates a deletion of about 40 amino acids seen when the cytochrome cd\(_1\) sequence is aligned to that of T. pantotropha. Primers designed to flank this region (FOR1, FOR2, REV1 and REV2) are indicated by horizontal arrows. The sequence obtained is annotated as follows; dotted underline = sequenced once in one direction, single underline = sequenced twice in forward direction, double underline = sequenced in both directions.

The four resulting PCR products were directly sequenced from low-melting point agarose using these primers. Figure 3.7 indicates the region, direction and strand coverage (forward, reverse or both) of the sequence obtained. This sequence was 100% identical to that deposited in the GenBank database. It is thus clear that the gene sequence is correct and that the tyrosyl and histidyl ligands in the protein from T. pantotropha really are absent from at least the Ps. stutzeri Zobell enzyme.

This result raises a number of possibilities. First, the c- and d\(_1\) haems in cytochrome cd\(_1\) in the oxidised state from Ps. stutzeri (and from other species) may be liganded by tyrosyl and histidyl residues lying elsewhere in the polypeptide chain. This would result in a substantially different tertiary structure in these enzymes and given the overall high sequence homology, does not seem to be a credible proposal. Second, the other cytochromes cd\(_1\) may have different haem ligands (such as the conserved methionines and histidines seen in Figure 3.4), which could preserve a similar structure to the T. pantotropha protein, but might be expected to result in different spectroscopic and biochemical properties. Third, the oxidised T. pantotropha enzyme structure may not be representative of the physiologically-active structure found in vivo; the latter, hypothetical, structure may have the haem ligands that are conserved between all cytochrome cd\(_1\) sequences.

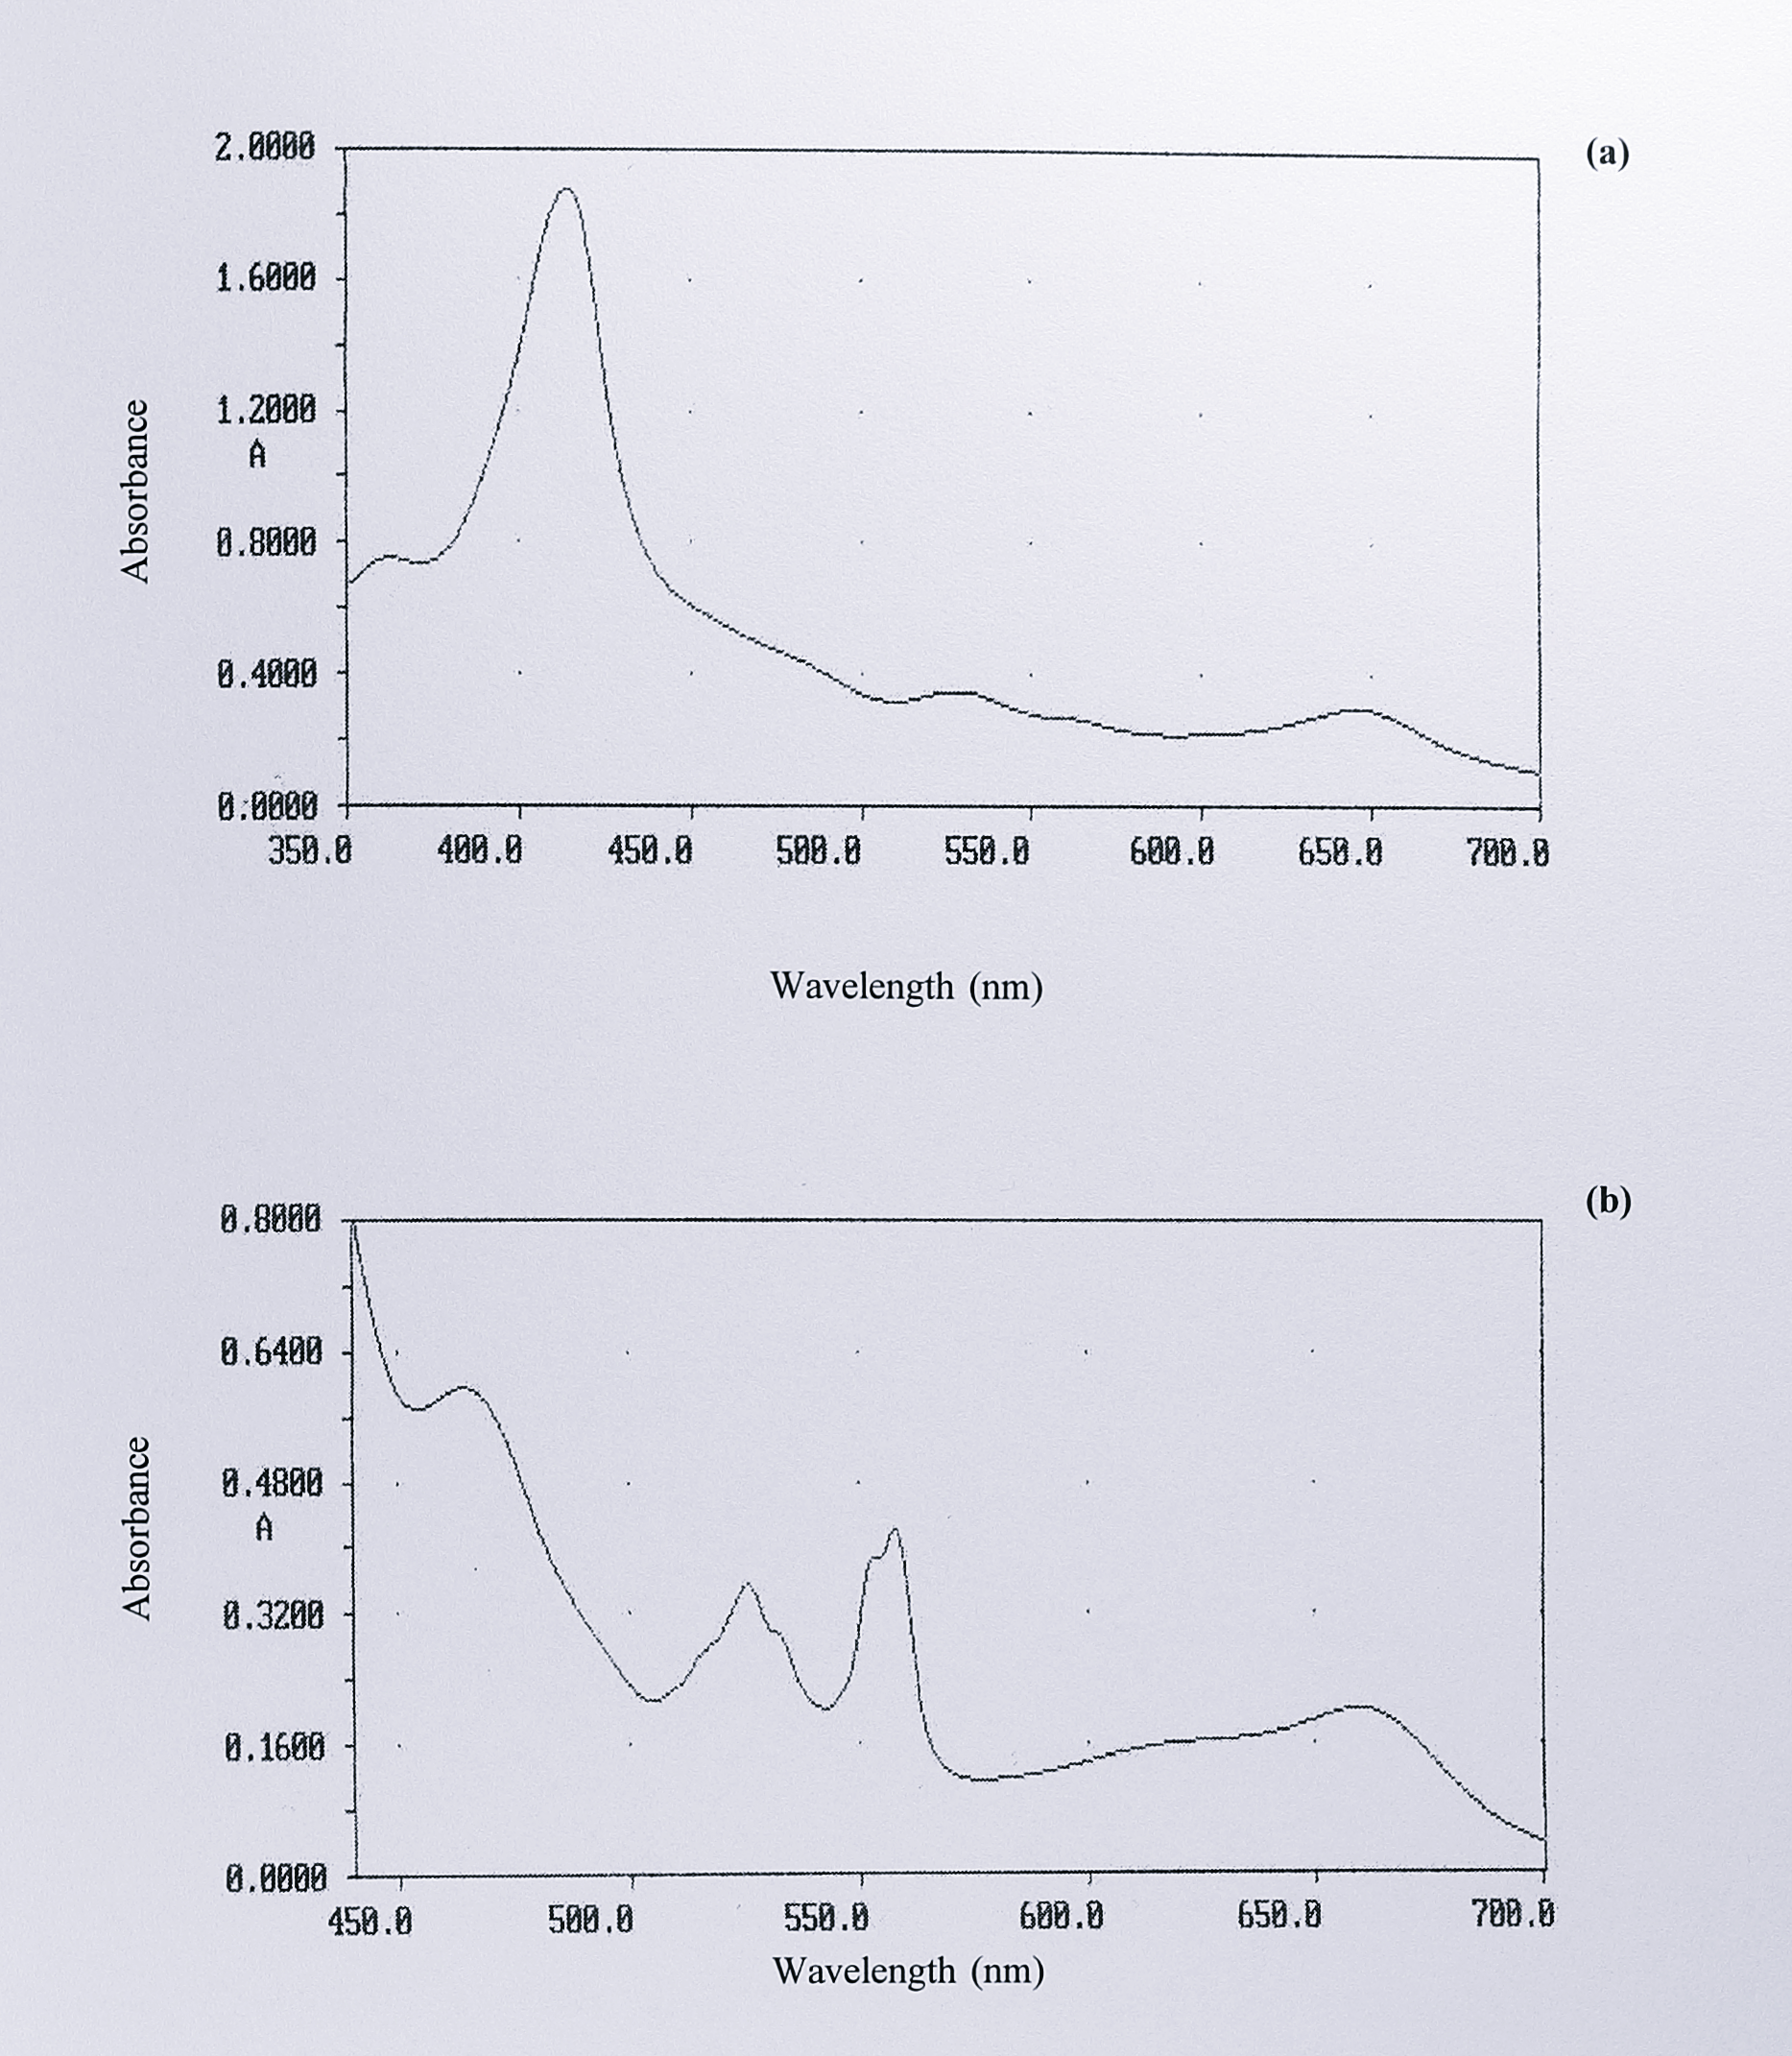
In order to examine the optical spectrum of cytochrome cd\(_1\) from Ps. stutzeri Zobell more closely, it was purified using the same procedure as that for the T. pantotropha protein. This protocol gave a product that was approximately 90-95% pure as judged by SDS-PAGE. The spectra of the oxidised and reduced forms of the enzyme are shown in Figure 3.8.

Visible spectra of cytochrome _cd_$_1$ (a) in the oxidised and (b) in the reduced forms from _Ps. stutzeri_ Zobell. As isolated, cytochrome _cd_$_1$ from _Ps. stutzeri_ Zobell exhibited absorbance maxima at 416, 526, 554 and 645 nm. Following reduction with dithionite maxima were observed at 421 (not shown), 464, 526, 553, 557 and 660 nm. The reversal in the relative amplitudes of the peaks at 548 and 554 nm referred to in the text is clearly visible in (b).

Figure 3.8: Visible spectra of cytochrome cd\(_1\) (a) in the oxidised and (b) in the reduced forms from Ps. stutzeri Zobell. As isolated, cytochrome cd\(_1\) from Ps. stutzeri Zobell exhibited absorbance maxima at 416, 526, 554 and 645 nm. Following reduction with dithionite maxima were observed at 421 (not shown), 464, 526, 553, 557 and 660 nm. The reversal in the relative amplitudes of the peaks at 548 and 554 nm referred to in the text is clearly visible in (b).

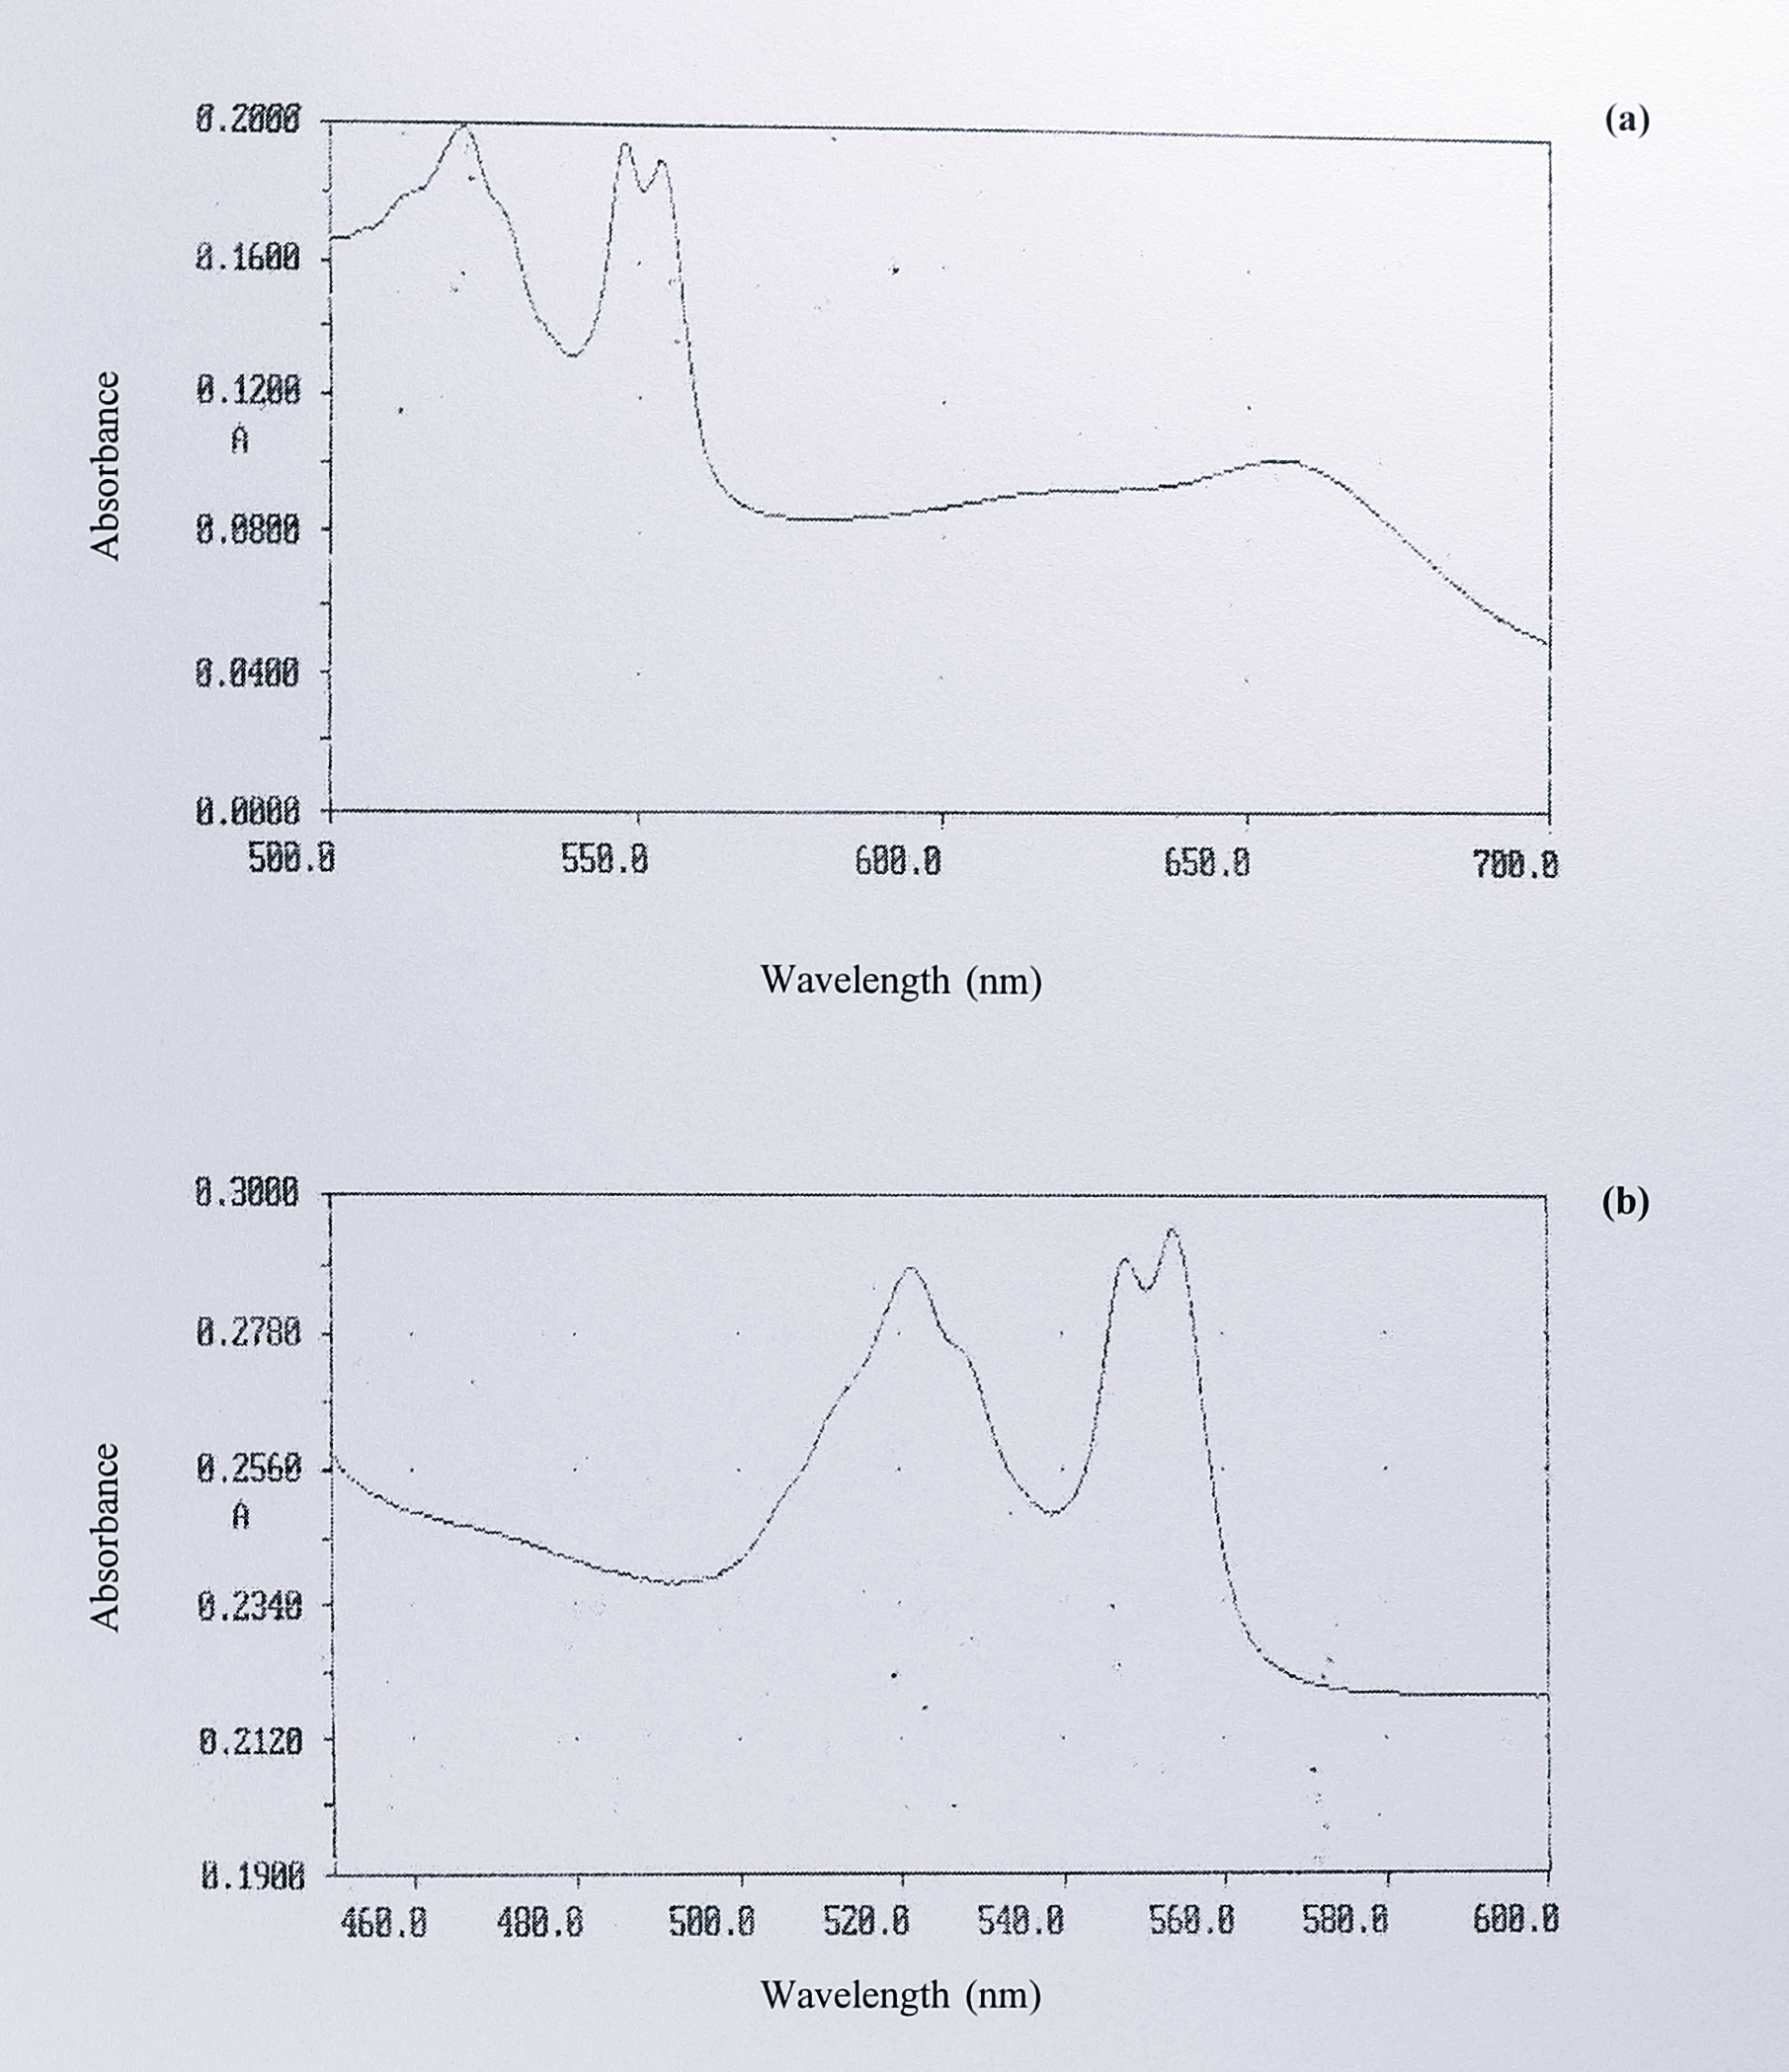
Overall, the spectra of the seven cytochromes cd\(_1\) that have been sequenced are very similar. In the oxidised form there are peaks at or near 411 and 640 nm, with shoulders around 561, 325 and 360 nm. In the reduced form, peaks at 418, 460, 521, 548, 554 and 625 nm (dithionite-reduced) or 655 nm (ascorbate-reduced) are seen. The absorbances at 655/625 and 460 nm are assigned to the d\(_1\) haem, whereas the 548-554, 521/525 and 418/411 nm peaks are the \(\alpha\), \(\beta\) and \(\gamma\) (Soret) peaks of the c-type haem. However, the enzyme from Ps. stutzeri Zobell shows a small, but interesting difference. In the split \(\alpha\)-peak of the reduced c haem at 548-554 nm, the first peak of the pair is slightly higher for the enzymes from T. pantotropha, P. denitrificans and Ps. aeruginosa. In the purified enzyme from Ps. stutzeri Zobell, this situation is reversed. This feature can be seen in published spectra by other workers [73] and was also specifically noted for the enzyme from Ps. stutzeri JM300 [253]. Interestingly, if the d\(_1\) haem is removed from the T. pantotropha protein to give the semi-apo enzyme, the relative heights of the split \(\alpha\)-peaks in the reduced state become reversed, so as to resemble the Ps. stutzeri enzymes (Figure 3.9).

Visible spectra of (a) holocytochrome _cd_$_1$ and (b) semi-apo cytochrome _cd_$_1$ in the reduced forms from _T. pantotropha_. The reduced holoprotein exhibited absorbance maxima at 418, 460 (not shown), 525, 548, 554 and 650 nm (a). Following removal of the _d_$_1$ haem the maxima at 460 and 650 nm (not shown) are lost and the amplitude of the peaks at 548 and 554 nm is reversed as compared to the holoprotein, as shown in (b).

Figure 3.9: Visible spectra of (a) holocytochrome cd\(_1\) and (b) semi-apo cytochrome cd\(_1\) in the reduced forms from T. pantotropha. The reduced holoprotein exhibited absorbance maxima at 418, 460 (not shown), 525, 548, 554 and 650 nm (a). Following removal of the d\(_1\) haem the maxima at 460 and 650 nm (not shown) are lost and the amplitude of the peaks at 548 and 554 nm is reversed as compared to the holoprotein, as shown in (b).

From the T. pantotropha crystal structure, we know that the Tyr-25 ligand originates in the c haem domain. Hence this result could be interpreted as showing that the d\(_1\) haem domain has a subtle effect on the absorption spectrum of the c haem, which is altered when the d\(_1\) haem is removed. The apparent lack of this effect in the Ps. stutzeri enzymes might be taken as evidence that a similar link between the c and d\(_1\) haem domains does not exist in these proteins. A second interpretation is that d\(_1\) haem loss is more extensive during the purification of the Ps. stutzeri enzymes, yielding a species more like the semi-apo enzyme. However, the observation of this spectrum by other groups and previously reported activity measurements [253] argue against this idea.

In fact, mounting spectroscopic evidence indicates that haem ligation is genuinely not identical in different cytochromes cd\(_1\). Magnetic circular dichroism (MCD) and electron paramagnetic resonance (EPR) spectroscopy of the cytochrome cd\(_1\) from Ps. aeruginosa have indicated Met-His ligation at the c haem and His-His ligation at the d\(_1\) haem [124]. EPR and Mössbauer spectroscopy of the enzyme from Thiobacillus denitrificans suggested His-His ligation at both haems [126]. More recently, the T. pantotropha and Ps. stutzeri proteins in the oxidised form have been compared using EPR and MCD spectroscopy at the University of East Anglia [125]. The latter method in particular is regarded as the most accurate diagnostic of haem ligation [269]. The EPR and MCD data are interpreted as being consistent with His-His ligation at the c haem in the T. pantotropha enzyme although, interestingly, a very small proportion of the sample appears to have Met-His ligation. The d\(_1\) haem ligands are more difficult to assign in the absence of data from model compounds, but are thought to be consistent with His-Tyr or possibly His-OH ligation in both cases. However, the c haem in the oxidised Ps. stutzeri enzyme is clearly Met-His ligated, as was previously reported for cytochrome cd\(_1\) from Ps. aeruginosa [124].

In summary, it is apparent that there are significant differences in haem ligation amongst the cytochromes cd\(_1\), though bis-histidyl ligation at the d\(_1\) haem and methionyl histidyl ligation at the c haem are commonly assigned to several members of the group. This brings us to the question of whether the T. pantotropha cytochrome cd\(_1\) crystal structure is anomalous or in some way misleading. There can be no doubt that the structure is “correct” in terms of the integrity of the diffraction data, its interpretation, the chain tracing methods used and correlation with the protein sequence; the question is whether the structure is physiologically relevant.

As described above, MCD spectra of the T. pantotropha enzyme confirm the bis histidyl ligation seen in the oxidised crystal structure, whereas the enzymes from Ps. stutzeri and Ps. aeruginosa are thought to have Met-His ligation to the c haem in the oxidised state. Recent work [166] has shown that in reduced crystals of cytochrome cd\(_1\) from T. pantotropha (which do not crack when reduced by sodium dithionite, unlike crystals of the Ps. aeruginosa enzyme [147], dramatic changes in haem ligation are observed. Tyr-25 is seen to move away from the d\(_1\) haem, as predicted by spectroscopic and mechanistic studies (Chapter 1, Section 1.5.4), but at the c haem His-17 is no longer a ligand. Instead, a loop of residues (100-114) moves upwards in the structure and Met-106 becomes a new c haem ligand. This arrangement means that the T. pantotropha enzyme in the reduced state more closely resembles the predicted ligation of the enzymes from Ps. aeruginosa and Ps. stutzeri; additionally Met-106 is a conserved residue in all cytochrome cd\(_1\) sequences.

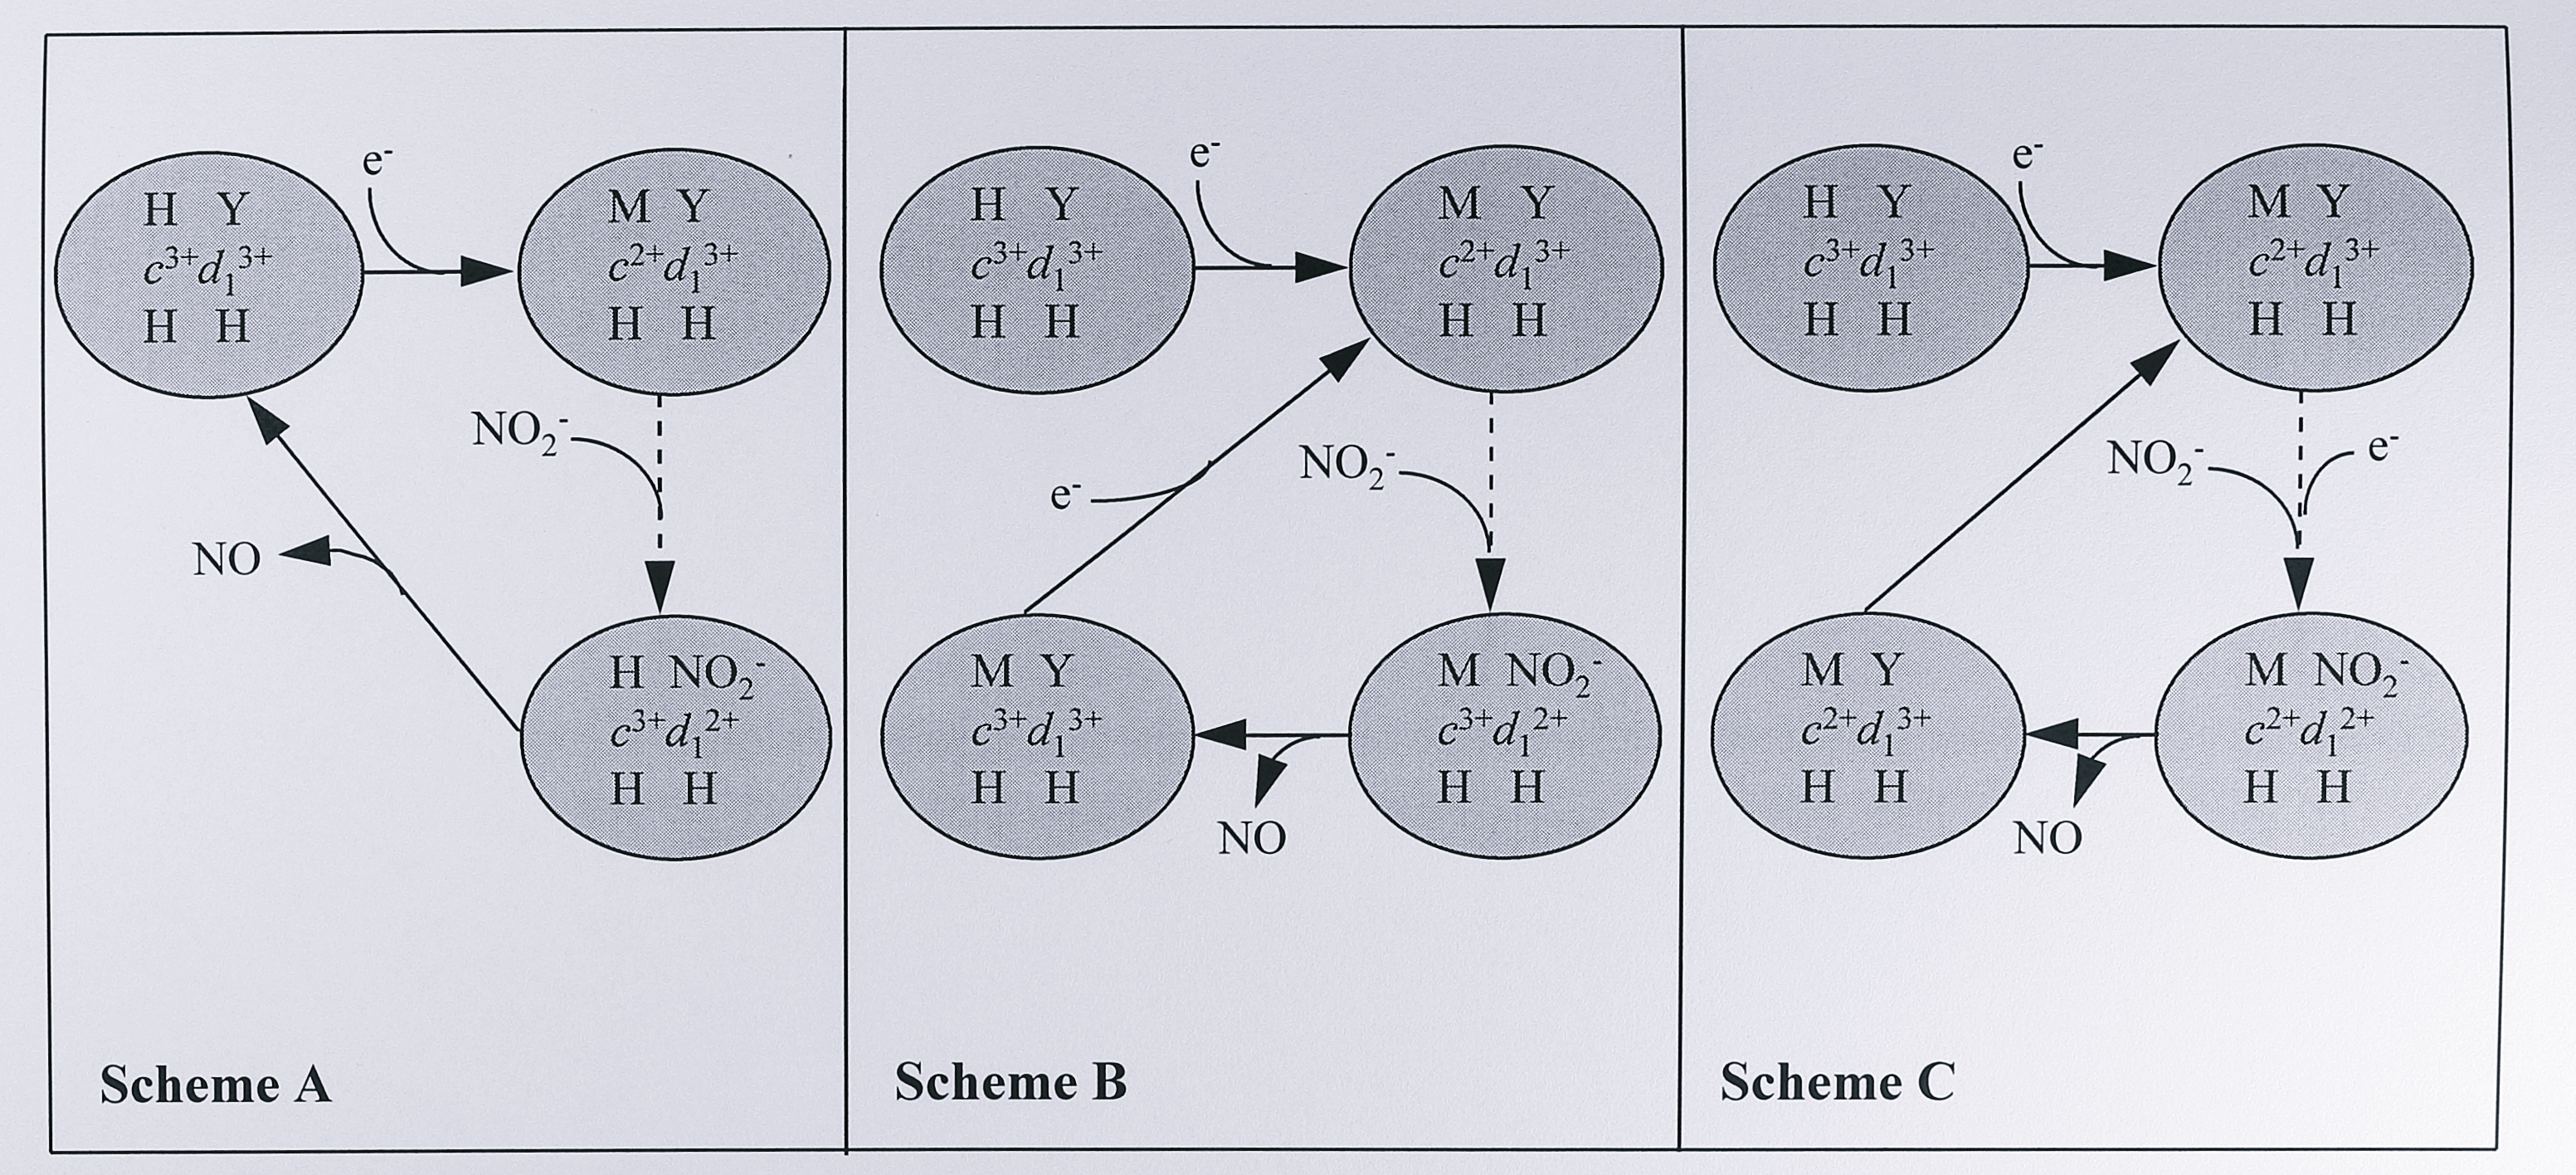
These data raise the possibility that the physiologically active form of T. pantotropha cytochrome cd\(_1\) is Met-His ligated at the c haem at all times, and that the fully-oxidised His His ligated species is a relaxed or resting artefact which is not returned to in the catalytic cycle. Three alternative reaction schemes are outlined in Figure 3.10.

Alternative reaction schemes for the reduction of nitrite by cytochrome _cd_$_1$ starting from the fully oxidised enzyme. (A) The _c_-haem switches to Met-His ligation on reduction. After intramolecular electron transfer to the _d_$_1$ haem, the re-oxidised _c_-haem switches back to His-His ligation. The fully oxidised enzyme is regenerated. (B) The _c_-haem becomes Met-His ligated on reduction and remains in this state even after reoxidisation. The fully oxidised state is regenerated, but His-His ligation is not. (C) The _c_-haem becomes His-Met ligated on reduction. After internal electron transfer to the _d_$_1$ haem, the _c_-haem is instantly re-reduced by an external electron donor protein and stays in the Met-His ligation state. Neither His-His ligation nor the fully oxidised enzyme are regenerated. Note that all schemes assume Tyr-25 returns to the _d_$_1$ haem after NO release. Dashed arrows indicate intramolecular electron transfer. M = methionine, H = histidine, Y = tyrosine.

Figure 3.10: Alternative reaction schemes for the reduction of nitrite by cytochrome cd\(_1\) starting from the fully oxidised enzyme. (A) The c-haem switches to Met-His ligation on reduction. After intramolecular electron transfer to the d\(_1\) haem, the re-oxidised c-haem switches back to His-His ligation. The fully oxidised enzyme is regenerated. (B) The c-haem becomes Met-His ligated on reduction and remains in this state even after reoxidisation. The fully oxidised state is regenerated, but His-His ligation is not. (C) The c-haem becomes His-Met ligated on reduction. After internal electron transfer to the d\(_1\) haem, the c-haem is instantly re-reduced by an external electron donor protein and stays in the Met-His ligation state. Neither His-His ligation nor the fully oxidised enzyme are regenerated. Note that all schemes assume Tyr-25 returns to the d\(_1\) haem after NO release. Dashed arrows indicate intramolecular electron transfer. M = methionine, H = histidine, Y = tyrosine.

In the first, the c haem returns to His-His ligation when it becomes reoxidised following intramolecular electron transfer to the d\(_1\) haem. In the second, the c haem remains Met-His ligated after reoxidation and a fully-oxidised His-His species is not regenerated. In the third, a fully oxidised enzyme is not regenerated because re-reduction of the c haem following the first intramolecular electron transfer to the d\(_1\) haem is very rapid, preventing the formation of the oxidised His-His ligation state. Further data using reduced crystals of the T. pantotropha enzyme [166] has provided some insight into which of these schemes may be correct. It has proved possible to soak the reduced crystals in potassium nitrite and then rapidly freeze them, capturing what are proposed to be structural intermediates in the catalytic cycle. The fully-reduced enzyme molecules in the crystal carry two electrons, which allows two turnovers of the enzyme. The freeze-quenched structures contain molecules captured after the binding of the second nitrite molecule and different structures show either nitrite or nitric oxide bound at the d\(_1\) haem. It is clear from the diffraction data that following the reduction of nitrite to nitric oxide at the d\(_1\) haem, the c haem has returned to His-His ligation, as in Figure 3.10a. Such a rearrangement of the haem ligands during catalysis was unexpected and it has been suggested that this is the rate-limiting step of the reaction [166]. It is also suggested that the mechanism prevents reduction of the d\(_1\) haem whilst NO is still bound; as His-17 and Tyr 25 are on the same stretch of the polypeptide chain, return of His-17 to the c haem would facilitate the re-ligation of the d\(_1\) haem by Tyr-25, displacing the bound NO. The c haem would then be re-reduced, change to Met-His ligation and transfer its electron to the d\(_1\) haem where Tyr-25 would be displaced to begin a new catalytic cycle.

However, the data from the experiments of Williams [166] are not complete. Crystalline cd\(_1\) molecules can undergo only two turnovers whereas in the periplasm it is possible that a constant supply of electrons from donor proteins would act to keep the c haem reduced and in the Met-His state. Notably, stopped flow experiments using the enzyme from Ps. aeruginosa showed that the c haem was more than 90% reduced at all times [162]. The conservation of Met-106 in all cytochrome cd\(_1\) sequences is also a strong argument for this residue to be more functionally important than His-17 in T. pantotropha cytochrome cd\(_1\). The issue will ultimately be resolved by further kinetic studies of cytochrome cd\(_1\), in conjunction with site-directed mutagenesis of His-17 and Met-106.

The role of the non-conserved Tyr-25 d\(_1\) haem ligand remains more problematic. It is clearly a ligand to the c haem in the oxidised crystal structure and can also be seen near the haem, having moved away, in the reduced state. Notably however, it has not yet been observed to return to the d\(_1\) haem in the crystal structure after NO release; this step remains hypothetical. Therefore at present it is not possible to say with certainty whether Tyr-25 plays a crucial role in the mechanism of T. pantotropha cytochrome cd\(_1\). The lack of sequence conservation in an otherwise highly homologous group of proteins does suggest that Tyr-25 may not be an obligatory residue. Alternatively we have to accept that for some reason, within a set of enzymes that are so strongly conserved as to suggest high structural homology, different functional residues are used for catalysis.

The clearest way to resolve this issue, as with the problem of haem ligation in the c domain, will be using site-directed mutagenesis to generate changes at Tyr-25 and analysis of the resultant proteins. As with all site-directed mutagenesis experiments, care will have to be taken to distinguish effects arising due to gross perturbation of the protein tertiary structure from those that involve only alteration around the haem ligation site. Bearing this in mind, obvious candidates for substitution at Tyr-25 are (1) phenylalanine, the same basic structure but lacking the liganding -OH moiety, (2) serine, of small size with an -OH group and (3) histidine, of similar size with the possibility of acting as a ligand, having been tentatively identified in other cytochromes cd\(_1\). This work is currently underway in our laboratory and some early data are presented in Chapter 6. Further crystal structures of other cytochromes cd\(_1\) will also be of great interest. The purified cytochrome cd\(_1\) from Ps. stutzeri Zobell, described in Section 3.4.3, was used for crystallisation trials by Dr. Vilmos Fülöp in the Laboratory of Molecular Biophysics and gave small crystals, though not of diffraction quality. However, we have since learned that the group of Dr. E.N. Baker (Massey University, New Zealand) is close to solving this structure, which should be available in the near future. Very recently the structure of cytochrome cd\(_1\) from Ps. aeruginosa has been determined (V. Fülöp, personal communication), although the details have not yet been published. Some aspects of this structure are discussed in Chapter 8.

References

42.
Peakman T, Crouzet J, Mayaux JF, Busby S, Mohan S, Harborne N, et al. Nucleotide sequence, organisation and structural analysis of the products of genes in the nirB-cysG region of the Escherichia coli K-12 chromosome. European Journal of Biochemistry. 1990;191: 315–323. doi:10.1111/j.1432-1033.1990.tb19125.x
73.
Zumft WG, Döhler K, Körner H, Löchelt S, Viebrock A, Frunzke K. Defects in cytochrome cd1-dependent nitrite respiration of transposon Tn5-induced mutants from Pseudomonas stutzeri. Archives of Microbiology. 1988;149: 492–498. doi:10.1007/BF00446750
96.
Hoeren FU, Berks BC, Ferguson SJ, McCarthy JE. Sequence and expression of the gene encoding the respiratory nitrous-oxide reductase from Paracoccus denitrificans. New and conserved structural and regulatory motifs. European Journal of Biochemistry. 1993;218: 49–57. doi:10.1111/j.1432-1033.1993.tb18350.x
101.
Moir JW, Baratta D, Richardson DJ, Ferguson SJ. The purification of a cd1-type nitrite reductase from, and the absence of a copper-type nitrite reductase from, the aerobic denitrifier Thiosphaera pantotropha; the role of pseudoazurin as an electron donor. European Journal of Biochemistry. 1993;212: 377–385. doi:10.1111/j.1432-1033.1993.tb17672.x
124.
Sutherland J, Greenwood C, Peterson J, Thomson AJ. An investigation of the ligand-binding properties of Pseudomonas aeruginosa nitrite reductase. The Biochemical Journal. 1986;233: 893–898. doi:10.1042/bj2330893
125.
Cheesman MR, Ferguson SJ, Moir JW, Richardson DJ, Zumft WG, Thomson AJ. Two enzymes with a common function but different heme ligands in the forms as isolated. Optical and magnetic properties of the heme groups in the oxidized forms of nitrite reductase, cytochrome cd1, from Pseudomonas stutzeri and Thiosphaera pantotropha. Biochemistry. 1997;36: 16267–16276. doi:10.1021/bi971677a
126.
Huynh BH, Lui MC, Moura JJ, Moura I, Ljungdahl PO, Münck E, et al. Mössbauer and EPR studies on nitrite reductase from Thiobacillus denitrificans. The Journal of Biological Chemistry. 1982;257: 9576–9581. doi:10.1016/S0021-9258(18)34110-3
127.
Fülöp V, Moir JW, Ferguson SJ, Hajdu J. The anatomy of a bifunctional enzyme: Structural basis for reduction of oxygen to water and synthesis of nitric oxide by cytochrome cd1. Cell. 1995;81: 369–377. doi:10.1016/0092-8674(95)90390-9
134.
Silvestrini MC, Tordi MG, Colosimo A, Antonini E, Brunori M. The kinetics of electron transfer between pseudomonas aeruginosa cytochrome c-551 and its oxidase. The Biochemical Journal. 1982;203: 445–451. doi:10.1042/bj2030445
138.
Jüngst A, Wakabayashi S, Matsubara H, Zumft WG. The nirSTBM region coding for cytochrome cd1-dependent nitrite respiration of Pseudomonas stutzeri consists of a cluster of mono-, di-, and tetraheme proteins. FEBS letters. 1991;279: 205–209. doi:10.1016/0014-5793(91)80150-2
139.
Smith GB, Tiedje JM. Isolation and characterization of a nitrite reductase gene and its use as a probe for denitrifying bacteria. Applied and Environmental Microbiology. 1992;58: 376–384. doi:10.1128/AEM.58.1.376-384.1992
140.
Ohshima T, Sugiyama M, Uozumi N, Iijima S, Kobayashi T. Cloning and sequencing of a gene encoding nitrite reductase from Paracoccus denitrificans and expression of the gene in Escherichia coli. Journal of Fermentation and Bioengineering. 1993;76: 82–88. doi:10.1016/0922-338X(93)90061-C
141.
Boer AP de, Reijnders WN, Kuenen JG, Stouthamer AH, Spanning RJ van. Isolation, sequencing and mutational analysis of a gene cluster involved in nitrite reduction in Paracoccus denitrificans. Antonie Van Leeuwenhoek. 1994;66: 111–127. doi:10.1007/BF00871635
142.
Rees E, Siddiqui RA, Köster F, Schneider B, Friedrich B. Structural gene (nirS) for the cytochrome cd1 nitrite reductase of Alcaligenes eutrophus H16. Applied and Environmental Microbiology. 1997;63: 800–802. doi:10.1128/AEM.63.2.800-802.1997
147.
Akey CW, Moffat K, Wharton DC, Edelstein SJ. Characterization of crystals of a cytochrome oxidase (nitrite reductase) from Pseudomonas aeruginosa by x-ray diffraction and electron microscopy. Journal of Molecular Biology. 1980;136: 19–43. doi:10.1016/0022-2836(80)90364-2
151.
Moore GR, Pettigrew GW. Cytochromes C Evolutionary, Structural and Physicochemical Aspects. Berlin, Heidelberg: Springer Berlin / Heidelberg; 1990. Available: http://public.eblib.com/choice/PublicFullRecord.aspx?p=6499030
162.
Silvestrini MC, Tordi MG, Musci G, Brunori M. The reaction of Pseudomonas nitrite reductase and nitrite. A stopped-flow and EPR study. The Journal of Biological Chemistry. 1990;265: 11783–11787. doi:10.1016/S0021-9258(19)38466-2
166.
Williams P. Time-resolved structural studies on macromolecules. PhD thesis, University of Oxford. 1996. Available: https://www.worldcat.org/title/time-resolved-structural-studies-on-macromolecules/oclc/43530285
188.
Spiro S. The FNR family of transcriptional regulators. Antonie Van Leeuwenhoek. 1994;66: 23–36. doi:10.1007/BF00871630
191.
Thompson JD, Higgins DG, Gibson TJ. CLUSTAL W: Improving the sensitivity of progressive multiple sequence alignment through sequence weighting, position-specific gap penalties and weight matrix choice. Nucleic Acids Research. 1994;22: 4673–4680. doi:10.1093/nar/22.22.4673
192.
Saitou N, Nei M. The neighbor-joining method: A new method for reconstructing phylogenetic trees. Molecular Biology and Evolution. 1987;4: 406–425. doi:10.1093/oxfordjournals.molbev.a040454
193.
Felsenstein J. CONFIDENCE LIMITS ON PHYLOGENIES: AN APPROACH USING THE BOOTSTRAP. Evolution; International Journal of Organic Evolution. 1985;39: 783–791. doi:10.1111/j.1558-5646.1985.tb00420.x
194.
Page RD. TreeView: An application to display phylogenetic trees on personal computers. Computer applications in the biosciences: CABIOS. 1996;12: 357–358. doi:10.1093/bioinformatics/12.4.357
197.
Van Spanning RJ, De Boer AP, Reijnders WN, Spiro S, Westerhoff HV, Stouthamer AH, et al. Nitrite and nitric oxide reduction in Paracoccus denitrificans is under the control of NNR, a regulatory protein that belongs to the FNR family of transcriptional activators. FEBS letters. 1995;360: 151–154. doi:10.1016/0014-5793(95)00091-m
240.
Moir J. Aspects of electron transport in Thiosphaera pantotropha and Paracoccus denitrificans. PhD thesis, University of Oxford. 1993. Available: https://ethos.bl.uk/OrderDetails.do?uin=uk.bl.ethos.386635
248.
Devereux J, Haeberli P, Smithies O. A comprehensive set of sequence analysis programs for the VAX. Nucleic Acids Research. 1984;12: 387–395. doi:10.1093/nar/12.1part1.387
253.
Weeg-Aerssens E, Wu WS, Ye RW, Tiedje JM, Chang CK. Purification of cytochrome cd1 nitrite reductase from Pseudomonas stutzeri JM300 and reconstitution with native and synthetic heme d1. The Journal of Biological Chemistry. 1991;266: 7496–7502. Available: https://www.jbc.org/article/S0021-9258(20)89474-5/pdf
254.
Hole UH, Vollack K-U, Zumft WG, Eisenmann E, Siddiqui RA, Friedrich B, et al. Characterization of the membranous denitrification enzymes nitrite reductase (cytochrome cd 1 ) and copper-containing nitrous oxide reductase from Thiobacillus denitrificans. Archives of Microbiology. 1996;165: 55–61. doi:10.1007/s002030050296
255.
Heijne G von. A new method for predicting signal sequence cleavage sites. Nucleic Acids Research. 1986;14: 4683–4690. doi:10.1093/nar/14.11.4683
256.
Nielsen H, Engelbrecht J, Brunak S, Heijne G von. Identification of prokaryotic and eukaryotic signal peptides and prediction of their cleavage sites. Protein Engineering. 1997;10: 1–6. doi:10.1093/protein/10.1.1
257.
Barton GJ. ALSCRIPT: A tool to format multiple sequence alignments. Protein Engineering. 1993;6: 37–40. doi:10.1093/protein/6.1.37
258.
Appel RD, Bairoch A, Hochstrasser DF. A new generation of information retrieval tools for biologists: The example of the ExPASy WWW server. Trends in Biochemical Sciences. 1994;19: 258–260. doi:10.1016/0968-0004(94)90153-8
259.
Steinrücke P, Ludwig B. Genetics of Paracoccus denitrificans. FEMS microbiology reviews. 1993;10: 83–117. doi:10.1016/0378-1097(93)90505-v
260.
Roth JR, Lawrence JG, Rubenfield M, Kieffer-Higgins S, Church GM. Characterization of the cobalamin (vitamin B12) biosynthetic genes of Salmonella typhimurium. Journal of Bacteriology. 1993;175: 3303–3316. doi:10.1128/jb.175.11.3303-3316.1993
261.
Klug G. A DNA sequence upstream of the puf operon of Rhodobacter capsulatus is involved in its oxygen-dependent regulation and functions as a protein binding site. Molecular & general genetics: MGG. 1991;226: 167–176. doi:10.1007/BF00273600
262.
Olsen GJ, Woese CR, Overbeek R. The winds of (evolutionary) change: Breathing new life into microbiology. Journal of Bacteriology. 1994;176: 1–6. doi:10.1128/jb.176.1.1-6.1994
263.
Fox GE, Wisotzkey JD, Jurtshuk P. How close is close: 16S rRNA sequence identity may not be sufficient to guarantee species identity. International Journal of Systematic Bacteriology. 1992;42: 166–170. doi:10.1099/00207713-42-1-166
264.
Baker SC, Saunders NF, Willis AC, Ferguson SJ, Hajdu J, Fülöp V. Cytochrome cd1 structure: Unusual haem environments in a nitrite reductase and analysis of factors contributing to beta-propeller folds. Journal of Molecular Biology. 1997;269: 440–455. doi:10.1006/jmbi.1997.1070
265.
Wallace CJ, Clark-Lewis I. Functional role of heme ligation in cytochrome c. Effects of replacement of methionine 80 with natural and non-natural residues by semisynthesis. The Journal of Biological Chemistry. 1992;267: 3852–3861. Available: https://www.jbc.org/article/S0021-9258(19)50604-4/pdf
266.
Dawson JH, Bracete AM, Huff AM, Kadkhodayan S, Zeitler CM, Sono M, et al. The active site structure of E. Coli HPII catalase. Evidence favoring coordination of a tyrosinate proximal ligand to the chlorin iron. FEBS letters. 1991;295: 123–126. doi:10.1016/0014-5793(91)81401-s
267.
Nagai M, Yoneyama Y. Reduction of methemoglobins M Hyde Park, M Saskatoon, and M Milwaukee by ferredoxin and ferredoxin-nicotinamide adenine dinucleotide phosphate reductase system. The Journal of Biological Chemistry. 1983;258: 14379–14384. doi:10.1016/S0021-9258(17)43872-5
268.
Hildebrand DP, Burk DL, Maurus R, Ferrer JC, Brayer GD, Mauk AG. The proximal ligand variant His93Tyr of horse heart myoglobin. Biochemistry. 1995;34: 1997–2005. doi:10.1021/bi00006a021
269.
Andersson LA, Johnson AK, Simms MD, Willingham TR. Comparative analysis of catalases: Spectral evidence against heme-bound water for the solution enzymes. FEBS letters. 1995;370: 97–100. doi:10.1016/0014-5793(95)00651-o