Chapter 5 Heterologous expression of the nirS gene from T. pantotropha in the denitrifying host Ps. aeruginosa
5.1 Introduction
In the previous chapter it was demonstrated that the nirS gene from T. pantotropha can be expressed in E. coli to give a semi-apo protein containing only c-type haem, and that this protein can be reconstituted with purified d\(_1\) haem to restore some nitrite reductase activity. There are a number of disadvantages to this approach, in particular the requirement for large quantities of purified d\(_1\) haem which can only be obtained from several tens of milligrams of purified cytochrome cd\(_1\). Additionally, the expression of the protein and the reconstitution protocol require substantial optimisation; heterogeneity in the reconstituted material may thus be a problem during crystallisation or attempts to compare thoroughly different samples.
An ideal expression system would, therefore, synthesise holo cytochrome cd\(_1\) that contained both the c- and d\(_1\) haems, in a form that could be easily purified, assayed for activity and crystallised for structural studies so as to compare site-directed mutants of the enzyme with the native protein. One approach to this may be to express the cloned nirS gene in a heterologous host which also contains an endogenous cytochrome cd\(_1\)-type nitrite reductase. This requires a denitrifying organism that is genetically amenable. It would be hoped that the cloned gene would be expressed at a sufficiently high level and that the recombinant protein would be translocated to the periplasm, where c-haem could be covalently attached. Additionally, a sufficient pool of free d\(_1\) haem would exist that could be sequestrated and incorporated into the recombinant cytochrome cd\(_1\). Finally the process should not compromise the growth of the host organism and the recombinant protein should be physically different to the endogenous nitrite reductase, so that it can be separated and purified for further analysis.
The experiments described in this chapter were designed to investigate the expression of the nirS gene from T. pantotropha in the host Ps. aeruginosa PAO1. The latter organism was selected using the criteria outlined above; it contains a cytochrome cd\(_1\) nitrite reductase [296] and systems for genetic manipulation have been developed in the organism [297]. Additionally, the isoelectric point of the cytochrome cd\(_1\) from this organism (approximately 7.0 [298]) is much more basic than that of the enzyme from T. pantotropha (predicted from the protein sequence to be 4.75), and so the expressed protein should be separable from the host cytochrome cd\(_1\) using ion exchange chromatography. The transformation of Ps. aeruginosa PAO1 with the expression plasmid pMMBSE is described and the remainder of the chapter focuses on the expression of the cloned nirS gene under different growth conditions, attempts to partially purify the expressed protein and initial analyses of the spectroscopic features and activity of the enzyme obtained.
5.2 Results
5.2.1 Transformation of Ps. aeruginosa PAO1 with the plasmid pMMBSE
The plasmid used to investigate expression of the nirS gene from T. pantotropha in Pseudomonas aeruginosa PAO1 was pMMBSE, construction and details of which were described in Chapter 4. The plasmid was transferred to Ps. aeruginosa by mobilisation from the donor E. coli strain S17-1. Mated cells were plated on Pseudomonas selective medium (Materials and Methods), containing 250 \(\mu\)g ml\(^{-1}\) carbenicillin, to obtain colonies of Ps. aeruginosa containing the plasmid. Single colonies so selected were picked, grown up in LB medium plus 250 \(\mu\)g ml\(^{-1}\) carbenicillin and tested for the presence of plasmid pMMBSE using plasmid purification (Promega Wizard miniprep) followed by restriction analysis with the enzyme HindIII. Figure 5.1 shows agarose gels of the digests from several colonies of Ps. aeruginosa.
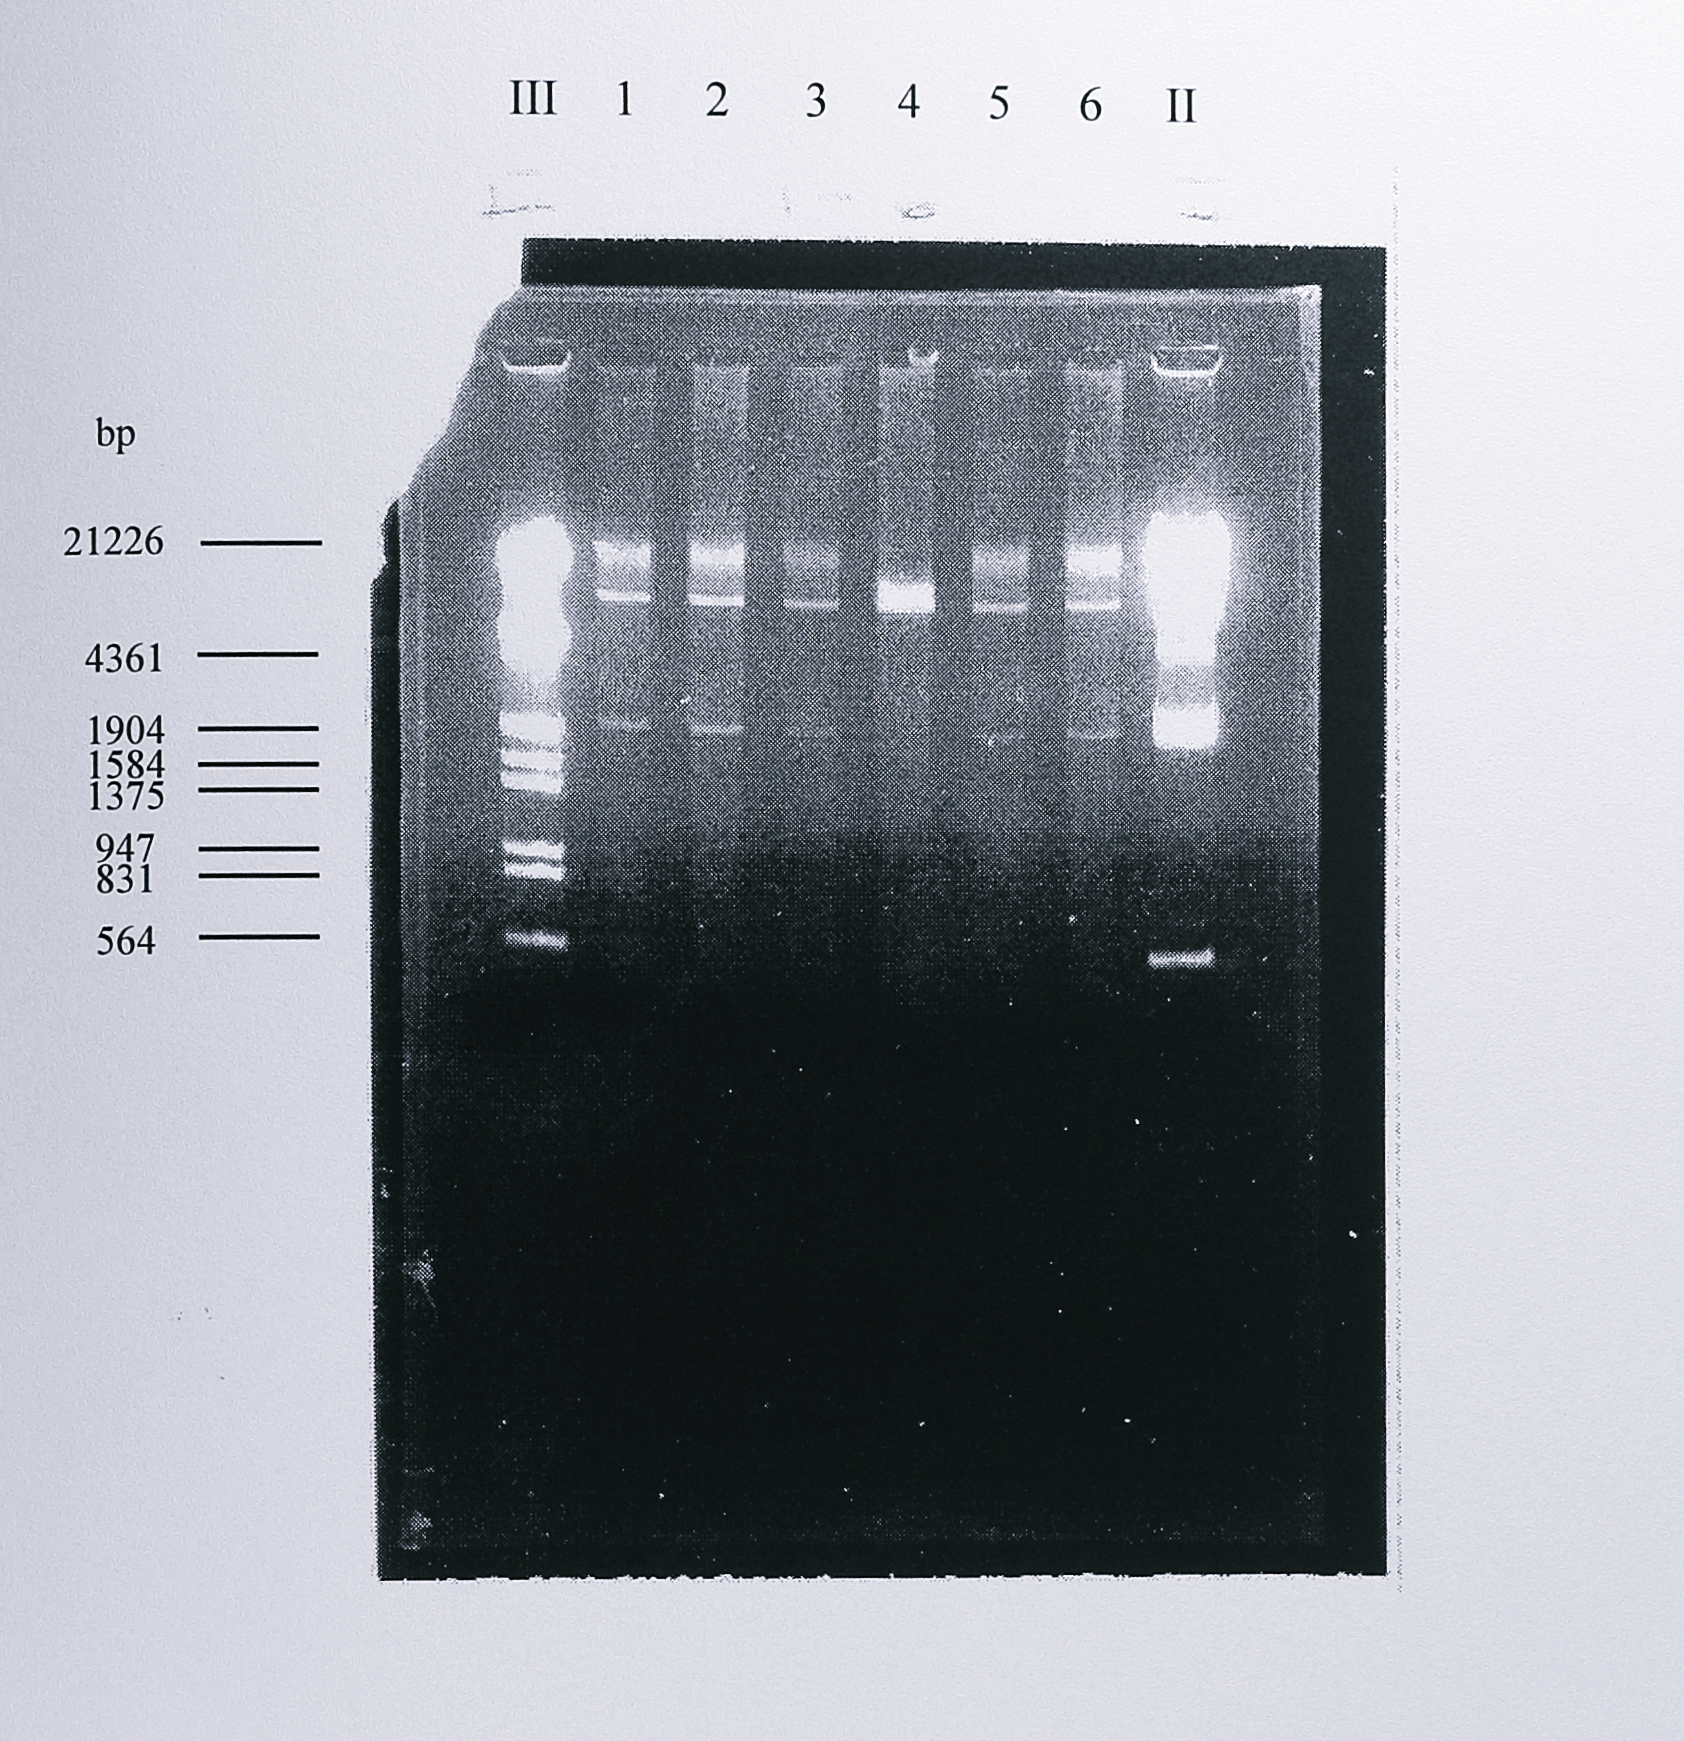
Figure 5.1: Re-isolation of intact plasmid pMMBSE from Ps. aeruginosa PAO1. Plasmid pMMBSE was introduced into Ps. aeruginosa PAO1 by conjugal transfer from E. coli S17-1. Following selection, the plasmid was isolated using the Promega Wizard miniprep kit and digested with HindIII. The fragments were separated by electrophoresis on a 0.8% agarose gel. This digest produces two fragments of approximately 9.3 and 1.9 kbp, seen clearly in lanes 1-3, 5 and 6. Lanes III and II contain DNA size standards, the sizes of some of which are indicated at the left of the gel.
Wizard minipreps from Ps. aeruginosa PAO1 were of consistently good quality and always yielded the expected fragments from the pMMBSE digest.
5.2.2 Analysis of expression from pMMBSE in Ps. aeruginosa PAO1 under different growth conditions
Ps. aeruginosa was found to be a convenient organism for the study of expression under different growth conditions, as it grew vigorously both aerobically in LB medium and anaerobically in LB plus 50 mM potassium nitrate. To analyse the growth of transformed cells, 50 ml cultures of Ps. aeruginosa PAO1 and Ps. aeruginosa PAO1 [pMMBSE] were grown either aerobically, aerobically plus 50 mM KNO\(_3\) or anaerobically. Additionally, cultures carrying the pMMBSE plasmid under each condition could be induced using 1 mM IPTG during the early exponential growth phase [297]. This set of conditions gave rise to nine different cultures, detailed in Table 5.1.
| Culture number | Growth conditions | pMMBSE present | IPTG added |
|---|---|---|---|
| 1 | aerobic | ||
| 2 | ✓ | ||
| 3 | ✓ | ✓ | |
| 4 | aerobic + 50 mM KNO\(_3\) | ||
| 5 | ✓ | ||
| 6 | ✓ | ✓ | |
| 7 | anaerobic | ||
| 8 | ✓ | ||
| 9 | ✓ | ✓ |
Growth was recorded by the increase in absorbance at 650 nm until stationary phase was reached and the resulting curves are shown in Figure 5.2.
![Comparison of the growth curves of _Ps. aeruginosa_ and _Ps. aeruginosa_ [pMMBSE] under different growth conditions. Overnight cultures were inoculated at a dilution of 1/100 into 50 ml of medium and growth was followed by the change in absorbance at 650 nm (logarithmic scale). Symbols: (◆) _Ps. aeruginosa_ aerobic, (■) _Ps. aeruginosa_ [pMMBSE] aerobic, (▲) _Ps. aeruginosa_ [pMMBSE] aerobic + induced, (◇) _Ps. aeruginosa_ aerobic + nitrate, (□) _Ps. aeruginosa_ [pMMBSE] aerobic + nitrate, (△) _Ps. aeruginosa_ [pMMBSE] aerobic + nitrate + induced, (diamond/strikethrough) _Ps. aeruginosa_ anaerobic. (square/strikethrough) Ps, aeruginosa [pMMBSE] anaerobic, (triangle/strikethrough) _Ps. aeruginosa_ [pMMBSE] anaerobic + induced.](figure/fig5-2.png)
Figure 5.2: Comparison of the growth curves of Ps. aeruginosa and Ps. aeruginosa [pMMBSE] under different growth conditions. Overnight cultures were inoculated at a dilution of 1/100 into 50 ml of medium and growth was followed by the change in absorbance at 650 nm (logarithmic scale). Symbols: (◆) Ps. aeruginosa aerobic, (■) Ps. aeruginosa [pMMBSE] aerobic, (▲) Ps. aeruginosa [pMMBSE] aerobic + induced, (◇) Ps. aeruginosa aerobic + nitrate, (□) Ps. aeruginosa [pMMBSE] aerobic + nitrate, (△) Ps. aeruginosa [pMMBSE] aerobic + nitrate + induced, (diamond/strikethrough) Ps. aeruginosa anaerobic. (square/strikethrough) Ps, aeruginosa [pMMBSE] anaerobic, (triangle/strikethrough) Ps. aeruginosa [pMMBSE] anaerobic + induced.
Aerobically, the growth of all cultures was the same, regardless of the presence of IPTG or nitrate. However, anaerobically, Ps. aeruginosa [pMMBSE] showed a marked growth defect, entered stationary phase much earlier than the wild-type and reached a lower final optical density of around 0.6. This occurred even in the absence of induction with IPTG. To investigate the defect further, cultures of Ps. aeruginosa and Ps. aeruginosa [pMMBSE] plus or minus IPTG were again grown anaerobically over a 13 hour period and their growth curves recorded. To estimate the level of nitrite reductase activity in each culture, 1 ml samples taken at each time point on the growth curve were harvested and the supernatant was assayed colorimetrically for the presence of nitrite. These data are shown in Figure 5.3.
![Comparison of (a) the growth curve and (b) nitrite accumulation of _Ps. aeruginosa_ with that of _Ps. aeruginosa_ [pMMBSE]. Growth is shown as absorbance at 650 nm (logarithmic scale) against time after inoculation. For nitrite determination, 1 ml samples were harvested at each time point and the supernatant was assayed for nitrite colorimetrically (Materials and Methods). Symbols: (◆) _Ps. aeruginosa_, (■) _Ps. aeruginosa_ [pMMBSE], (▲) _Ps. aeruginosa_ [pMMBSE] induced using 1 mM IPTG.](figure/fig5-3.png)
Figure 5.3: Comparison of (a) the growth curve and (b) nitrite accumulation of Ps. aeruginosa with that of Ps. aeruginosa [pMMBSE]. Growth is shown as absorbance at 650 nm (logarithmic scale) against time after inoculation. For nitrite determination, 1 ml samples were harvested at each time point and the supernatant was assayed for nitrite colorimetrically (Materials and Methods). Symbols: (◆) Ps. aeruginosa, (■) Ps. aeruginosa [pMMBSE], (▲) Ps. aeruginosa [pMMBSE] induced using 1 mM IPTG.
In all samples, the nitrite concentration rose to a maximum of around 3.4 mM near the end of the exponential growth phase. In wild-type cells, it then declined very rapidly, to undetectable levels within two hours. In contrast nitrite concentration remained near the maximum level reached in Ps. aeruginosa [pMMBSE], regardless of induction, throughout stationary phase. Samples of these cultures assayed after a further 12 hours contained similar levels of nitrite (not shown).
The nine different cultures used to obtain the first set of growth curves were harvested and total soluble extracts were prepared by sonication and ultracentrifugation. Samples from each extract were separated by SDS-PAGE and stained for protein using Coomassie Blue (Figure 5.4).
![Comparison of the protein content of _Ps. aeruginosa_ with that of _Ps. aeruginosa_ [pMMBSE] under different growth conditions. 40 $\mu$g of protein from the soluble extracts indicated was separated by electrophoresis on an 8% SDS-PAGE gel and stained for protein using Coomassie Brilliant Blue R250. The lane labelled M contained molecular weight markers, the sizes of which are indicated at the left of the gel. A 63 kDa band, corresponding to expressed _T. pantotropha_ cytochrome _cd_$_1$ is visible in lanes 4 and 7.](figure/fig5-4.png)
Figure 5.4: Comparison of the protein content of Ps. aeruginosa with that of Ps. aeruginosa [pMMBSE] under different growth conditions. 40 \(\mu\)g of protein from the soluble extracts indicated was separated by electrophoresis on an 8% SDS-PAGE gel and stained for protein using Coomassie Brilliant Blue R250. The lane labelled M contained molecular weight markers, the sizes of which are indicated at the left of the gel. A 63 kDa band, corresponding to expressed T. pantotropha cytochrome cd\(_1\) is visible in lanes 4 and 7.
The region in which cytochrome cd\(_1\) is found stained quite densely, but a clear band of 63 kDa, (which corresponds to the size of mature cytochrome cd\(_1\) from T. pantotropha) was visible in the induced sample grown aerobically and anaerobically with nitrate. The same band was not clearly seen in induced, anaerobically grown samples due to their poor growth (data not shown). A band running with slightly lower mobility was observed in the samples from wild-type cells grown aerobically plus nitrate and anaerobically; this band corresponded to the endogenous cytochrome cd\(_1\) which has a slightly lower molecular weight than its counterpart from T. pantotropha (Table 3.4. Chapter 3). To compare the effect on expression of growth under either aerobic or anaerobic conditions an identical set of samples, except for Ps. aeruginosa [pMMBSE] grown aerobically with nitrate, were again separated by SDS-PAGE under the same conditions, transferred to a nitrocellulose membrane by semi-dry electroblotting and probed with the P. denitrificans cytochrome cd\(_1\) antibody. The Western blot is shown in Figure 5.5.
![Western blot of protein samples from _Ps. aeruginosa_ or _Ps. aeruginosa_ [pMMBSE] grown under different growth conditions, probed using antibody to cytochrome _cd_$_1$. 40 $\mu$g of protein from the cultures indicated was loaded in each lane and separated by SDS-PAGE in an 8% acrylamide gel. The samples were then transferred to a nitrocellulose membrane by semi-dry electroblotting and probed with antibody as detailed in Materials and Methods.](figure/fig5-5.png)
Figure 5.5: Western blot of protein samples from Ps. aeruginosa or Ps. aeruginosa [pMMBSE] grown under different growth conditions, probed using antibody to cytochrome cd\(_1\). 40 \(\mu\)g of protein from the cultures indicated was loaded in each lane and separated by SDS-PAGE in an 8% acrylamide gel. The samples were then transferred to a nitrocellulose membrane by semi-dry electroblotting and probed with antibody as detailed in Materials and Methods.
Only two samples tested positive with this antibody, those from Ps. aeruginosa [pMMBSE] grown aerobically or anaerobically and induced with IPTG. Each sample showed a band of the same mobility as native purified cytochrome cd\(_1\) from T. pantotropha, with a more intense staining reaction in the anaerobic sample. The latter sample also showed a smeared high molecular weight band, near the top of the gel.
Next, the c-type cytochrome content of each sample was analysed by SDS-PAGE followed by staining for covalently attached haem. In all samples grown aerobically the only detectable band was that of the low molecular weight cytochrome c\(_{551}\) (9 kDa); this was seen only on gels of 10% acrylamide or more (not shown). 100 \(\mu\)g of protein from the anaerobically and aerobically plus nitrate grown samples was separated on 8% acrylamide gels and stained for haem (Figure 5.6).
![Comparison of the _c_-type cytochrome content of _Ps. aeruginosa_ with that of _Ps. aeruginosa_ [pMMBSE] under different growth conditions. 100 $\mu$g of protein from the cultures indicated was loaded in each lane and separated by SDS-PAGE in a 6% acrylamide gel. The gel was stained for covalently-attached haem as described in Materials and Methods. Lane Tp contained 5 $\mu$g of purified cytochrome _cd_$_1$ from _T. pantotropha_.](figure/fig5-6.png)
Figure 5.6: Comparison of the c-type cytochrome content of Ps. aeruginosa with that of Ps. aeruginosa [pMMBSE] under different growth conditions. 100 \(\mu\)g of protein from the cultures indicated was loaded in each lane and separated by SDS-PAGE in a 6% acrylamide gel. The gel was stained for covalently-attached haem as described in Materials and Methods. Lane Tp contained 5 \(\mu\)g of purified cytochrome cd\(_1\) from T. pantotropha.
A doublet of around 60 kDa was seen in the lane containing extract from anaerobically-grown Ps. aeruginosa and in the extract from cells grown aerobically with nitrate; this doublet corresponded to the endogenous cytochrome cd\(_1\). In samples from cells containing plasmid pMMBSE but not induced with IPTG, the intensity of this band was greatly attenuated (lane 2). When the cultures were induced (lane 3), the band was again attenuated and a new doublet of slightly higher molecular weight appeared. The latter doublet stained most strongly in the aerobically grown cultures plus nitrate (lane 6) and had the same mobility as purified cytochrome cd\(_1\) from T. pantotropha (lane 7). These experiments showed that the nirS gene from T. pantotropha expressed to a high level in Ps. aeruginosa PAO1 when induced with IPTG, particularly under anaerobic denitrifying growth conditions. The next step was to attempt a partial purification of the recombinant protein. A 1 l culture of Ps. aeruginosa [pMMBSE] was grown anaerobically to early exponential phase, induced with 1 mM IPTG and grown for a further 10 hours to a final A\(_{650}\) of about 0.8. The cells were harvested and an attempt to prepare a periplasmic extract was made by spheroplasting in the normal way, except for the omission of EDTA which was found to cause cell lysis. The extract obtained was extremely pale brown in colour, and so it was decided to improve the extraction at the expense of initial purity by using a total soluble extract, prepared as before by sonication and ultracentrifugation. This extract was applied to a small DEAE-Sepharose column (1 x 10 cm), previously equilibrated with 50 mM Tris-HCl pH 8.0, washed with several column volumes of the same buffer and eluted with a 250 ml linear gradient of 0-400 mM NaCl in the same buffer. However, it was noticed that after application of the sample to the column the flow rate became very irregular. The elution profile, obtained by measuring the A\(_{410}\) of the fractions was also very irregular and no peaks corresponding to the elution of haem proteins could be resolved.
The problem of poor column flow may have occurred for a number of reasons. The initial hypothesis was that the aggregated material observed on the Western blot of anaerobically grown induced cell extracts may have been causing a blockage in the column. However, the aggregate was not observed in aerobic samples and as it is known that in Ps. aeruginosa holocytochrome cd\(_1\) is expressed aerobically if nitrate is present [217], it was thought possible that some recombinant holoprotein might be produced under the same conditions, but without the risk of aggregation. To achieve this a 1 l culture was grown in a 5 1 flask with low shaking (100 rpm), induced as before and harvested after 10 hours. Additional steps were taken to reduce the risk of poor performance during the ion exchange chromatography. First, as lysed cells of Ps. aeruginosa produce substantial amounts of polysaccharides and DNA, the harvested cells were broken by a freeze-thaw lysozyme treatment, followed by incubation with 100 U of DNase. This material was filtered before application to a slightly larger DEAE-Sepharose column (2 x 12 cm) in order to reduce irregularities in the flow due to surface tension at the column walls. The material was then eluted using a 250 ml linear gradient of 0-400 mM NaCl as before. This time a clean, well-resolved elution profile was obtained, as shown in Figure 5.7.
![Elution profile during ion-exchange chromatography of soluble extract from _Ps. aeruginosa_ [pMMBSE] grown semi-aerobically with nitrate and induced using IPTG. A 1 l culture of _Ps. aeruginosa_ [pMMBSE] was grown semi-aerobically with 50 mM KNO$_3$ and induced with 1 mM IPTG. A total soluble extract was prepared and bound to a DEAE-Sepharose column (2 x 12 cm) previously equilibrated with 50 mM Tris-HCI pH 8.0, washed with several column volumes of the same buffer and eluted using a 250 ml linear gradient of 0-400 mM NaCl. Symbols: (■) absorbance at 410 nm, (◆) NaCl concentration](figure/fig5-7.png)
Figure 5.7: Elution profile during ion-exchange chromatography of soluble extract from Ps. aeruginosa [pMMBSE] grown semi-aerobically with nitrate and induced using IPTG. A 1 l culture of Ps. aeruginosa [pMMBSE] was grown semi-aerobically with 50 mM KNO\(_3\) and induced with 1 mM IPTG. A total soluble extract was prepared and bound to a DEAE-Sepharose column (2 x 12 cm) previously equilibrated with 50 mM Tris-HCI pH 8.0, washed with several column volumes of the same buffer and eluted using a 250 ml linear gradient of 0-400 mM NaCl. Symbols: (■) absorbance at 410 nm, (◆) NaCl concentration
Three peaks of absorbance at 410 nm were seen, eluting at approximately 125, 225 and 250 mM NaCl.
Fractions from around the top of peaks 2 and 3 were run on an 8% acrylamide SDS PAGE gel, along with a sample of total soluble extract from Ps. aeruginosa [pMMBSE] grown anaerobically and induced with 1 mM IPTG, and stained for covalently-bound haem (Figure 5.8).
![Analysis of the _c_-type cytochrome content in the elution profile of soluble extract from _Ps. aeruginosa_ [pMMBSE] following ion exchange chromatography. 15 $\mu$l of each fraction was loaded in each lane and separated by SDS-PAGE in an 8% acrylamide gel. Lanes are numbered according to the fraction loaded and the peak from which the fractions were taken is indicated. Lane S contained 100 $\mu$g of total soluble extract from _Ps. aeruginosa_ [pMMBSE] grown anaerobically and induced with 1 mM IPTG. In lane S the endogenous (60 kDa) and recombinant (63 kDa) cytochrome _cd_$_1$ are indicated.](figure/fig5-8.png)
Figure 5.8: Analysis of the c-type cytochrome content in the elution profile of soluble extract from Ps. aeruginosa [pMMBSE] following ion exchange chromatography. 15 \(\mu\)l of each fraction was loaded in each lane and separated by SDS-PAGE in an 8% acrylamide gel. Lanes are numbered according to the fraction loaded and the peak from which the fractions were taken is indicated. Lane S contained 100 \(\mu\)g of total soluble extract from Ps. aeruginosa [pMMBSE] grown anaerobically and induced with 1 mM IPTG. In lane S the endogenous (60 kDa) and recombinant (63 kDa) cytochrome cd\(_1\) are indicated.
Fractions from both peaks showed a single haem-staining doublet with identical mobility. The doublet was also seen in the total soluble extract and appeared slightly higher in the gel than a second band which corresponded to the endogenous cytochrome cd\(_1\) at about 60 kDa. The doublet in the samples from both peak 2 and peak 3 therefore corresponded to expressed T. pantotropha cytochrome cd\(_1\).
The eluted fractions from the DEAE-Sepharose column were very dilute and so the top fractions from peaks 2 and 3 were pooled and each pool was concentrated to about 1 ml by centrifugation in an Amicon-30 microconcentrator. Following concentration, the material from peak 2 was pale pink, whereas that from peak 3 was orange-brown. The spectra of the concentrated fractions were recorded. Figure 5.9a and 5.9b shows a spectrum of the material from peak 2; absorbance maxima were observed at 289, 415, 522, 548 and 554 nm.
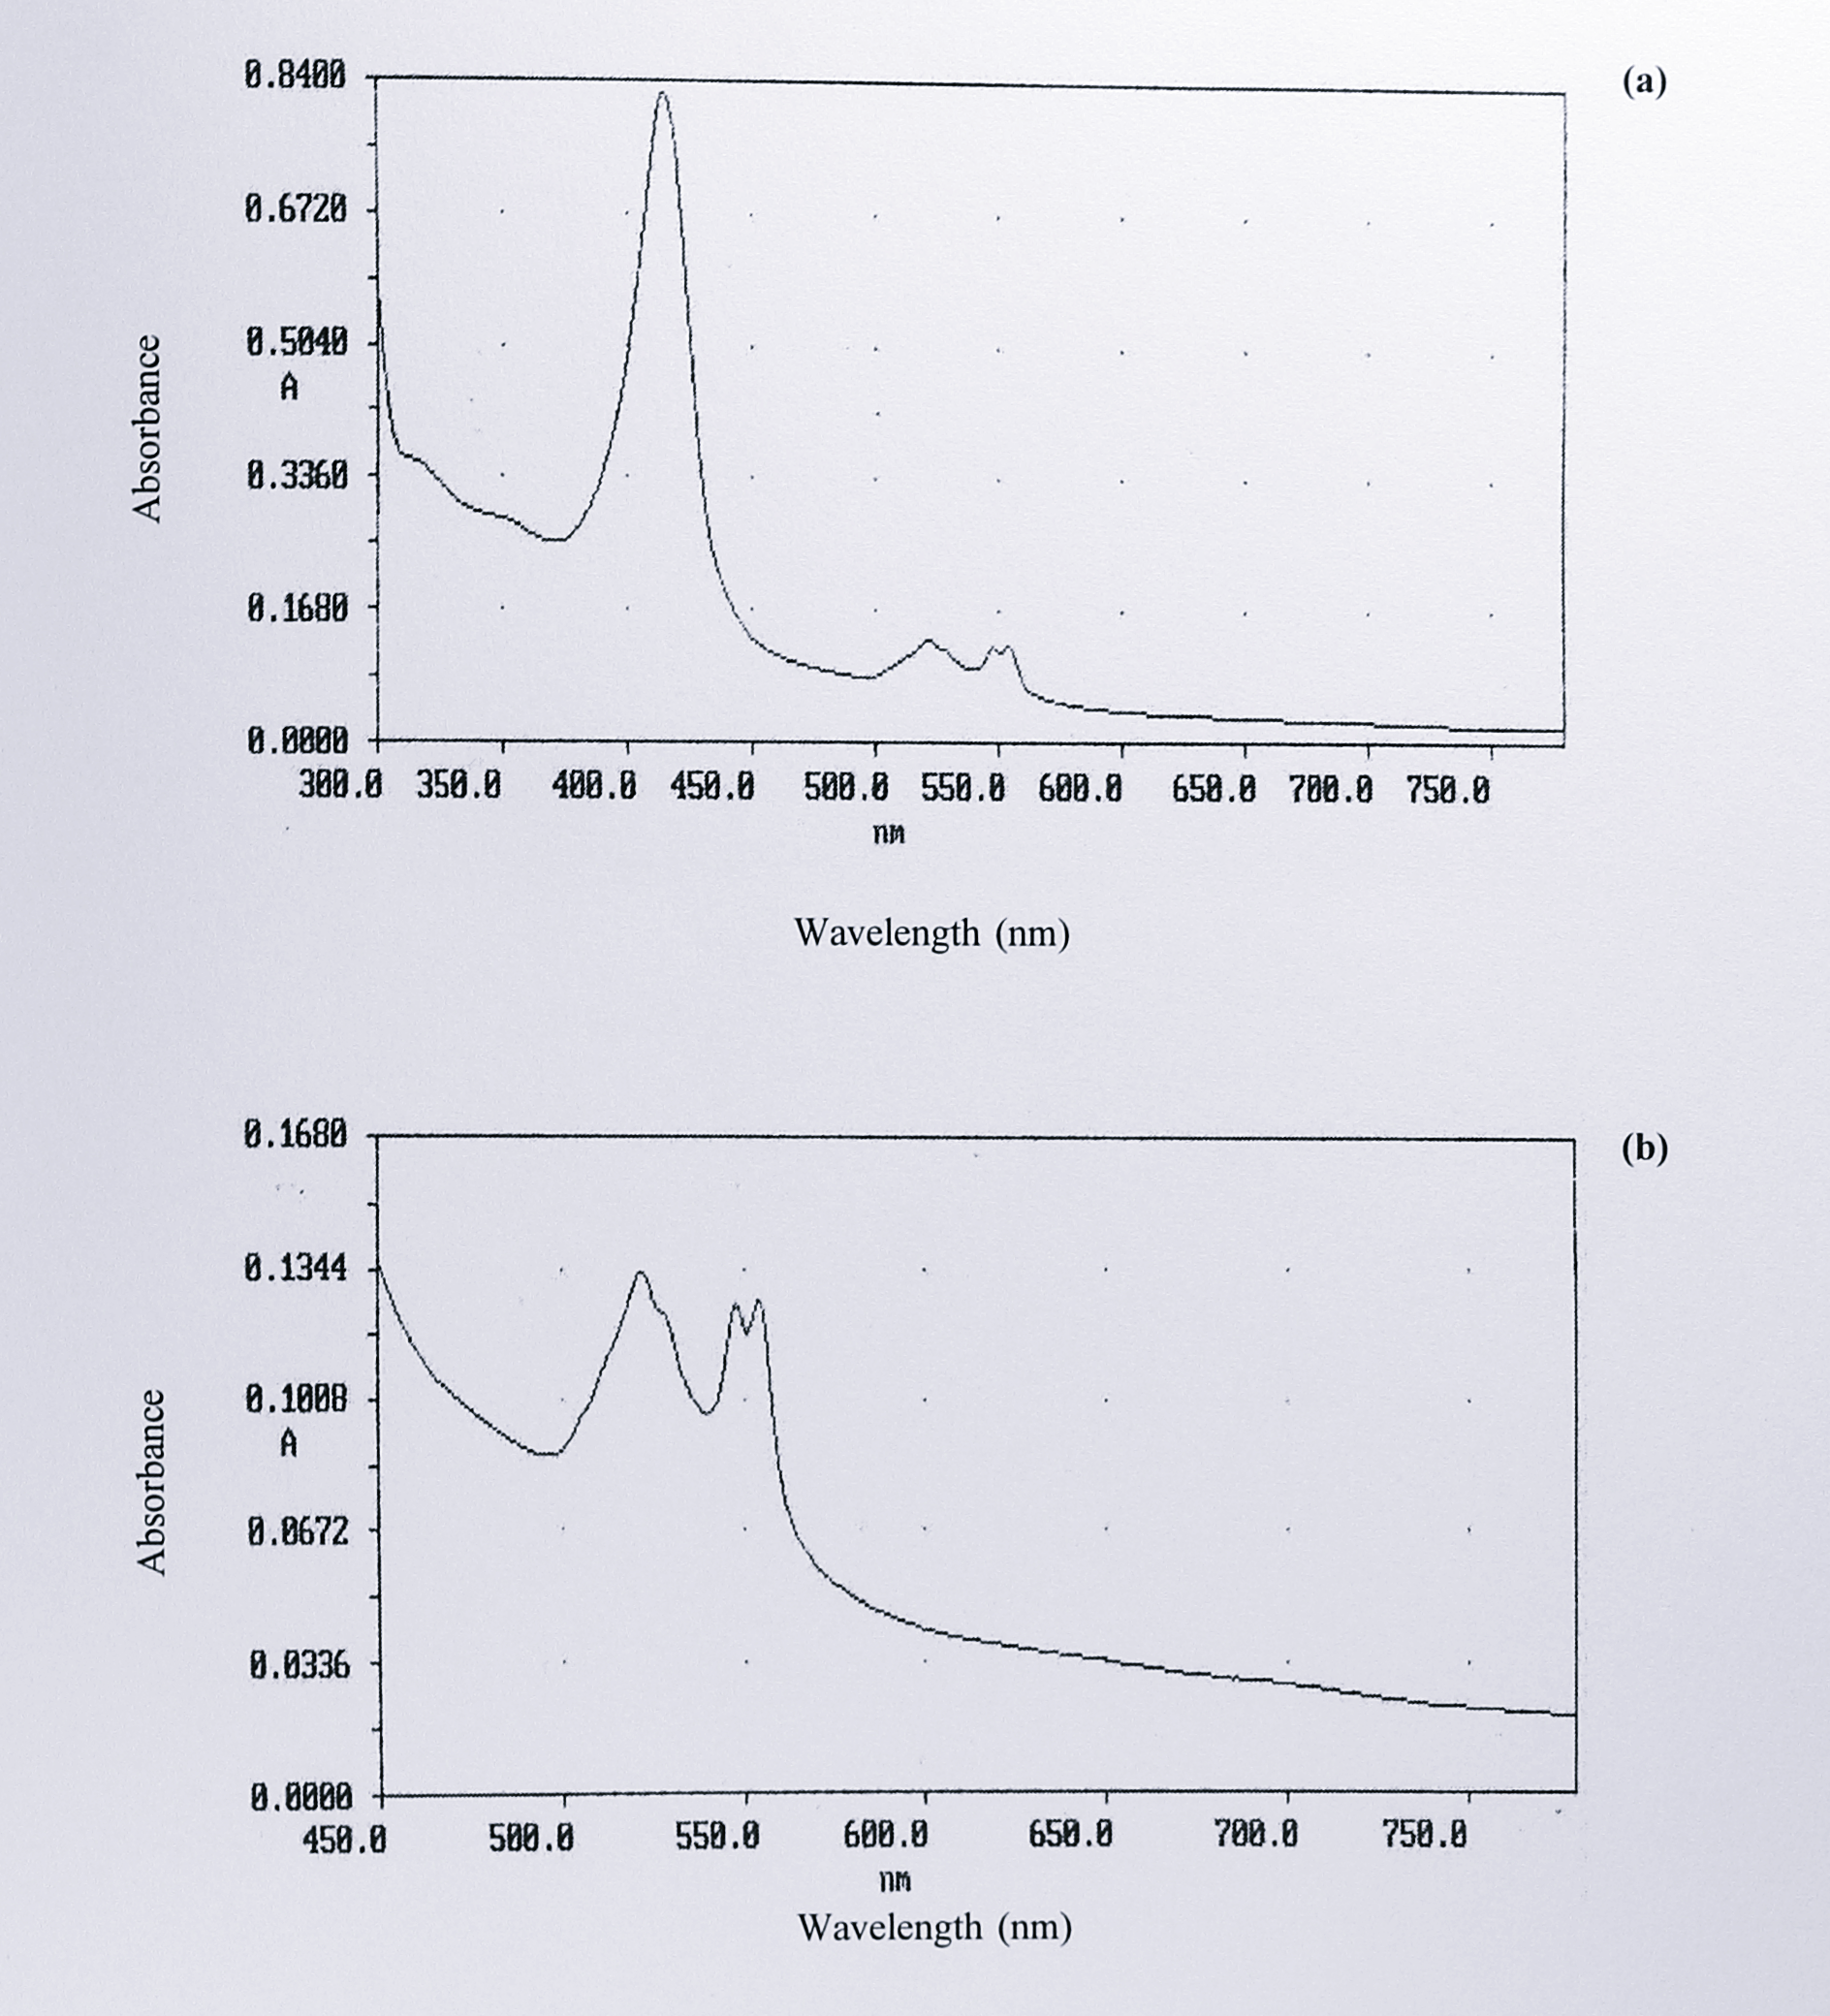
Figure 5.9: UV-visible spectrum of concentrated fractions eluting under peak 2 following DEAE-Sepharose chromatography. Five fractions from the top of peak 2 (Figure 5.7) were pooled and concentrated to approximately 1 ml by centrifugation in an Amicon-30 microconcentrator Absorbance maxima were observed at 289 (not shown), 415, 522 548 and 554 nm. (b) is an expansion of the region from 440-800 nm in (a), showing the split \(\alpha\)-peak and the absence of d\(_1\) haem absorbance features. No change in the spectrum was observed on the addition of sodium dithionite (not shown).
The spectrum was virtually identical to that of the T. pantotropha semi-apo cytochrome cd\(_1\) expressed in E. coli (Chapter 4, Figure 4.13). No change in this spectrum was observed on the addition of sodium dithionite. Figure 5.10a shows the spectrum from peak 3, with 288 409 and 523 nm, and smaller peaks at 547 and 628 nm.
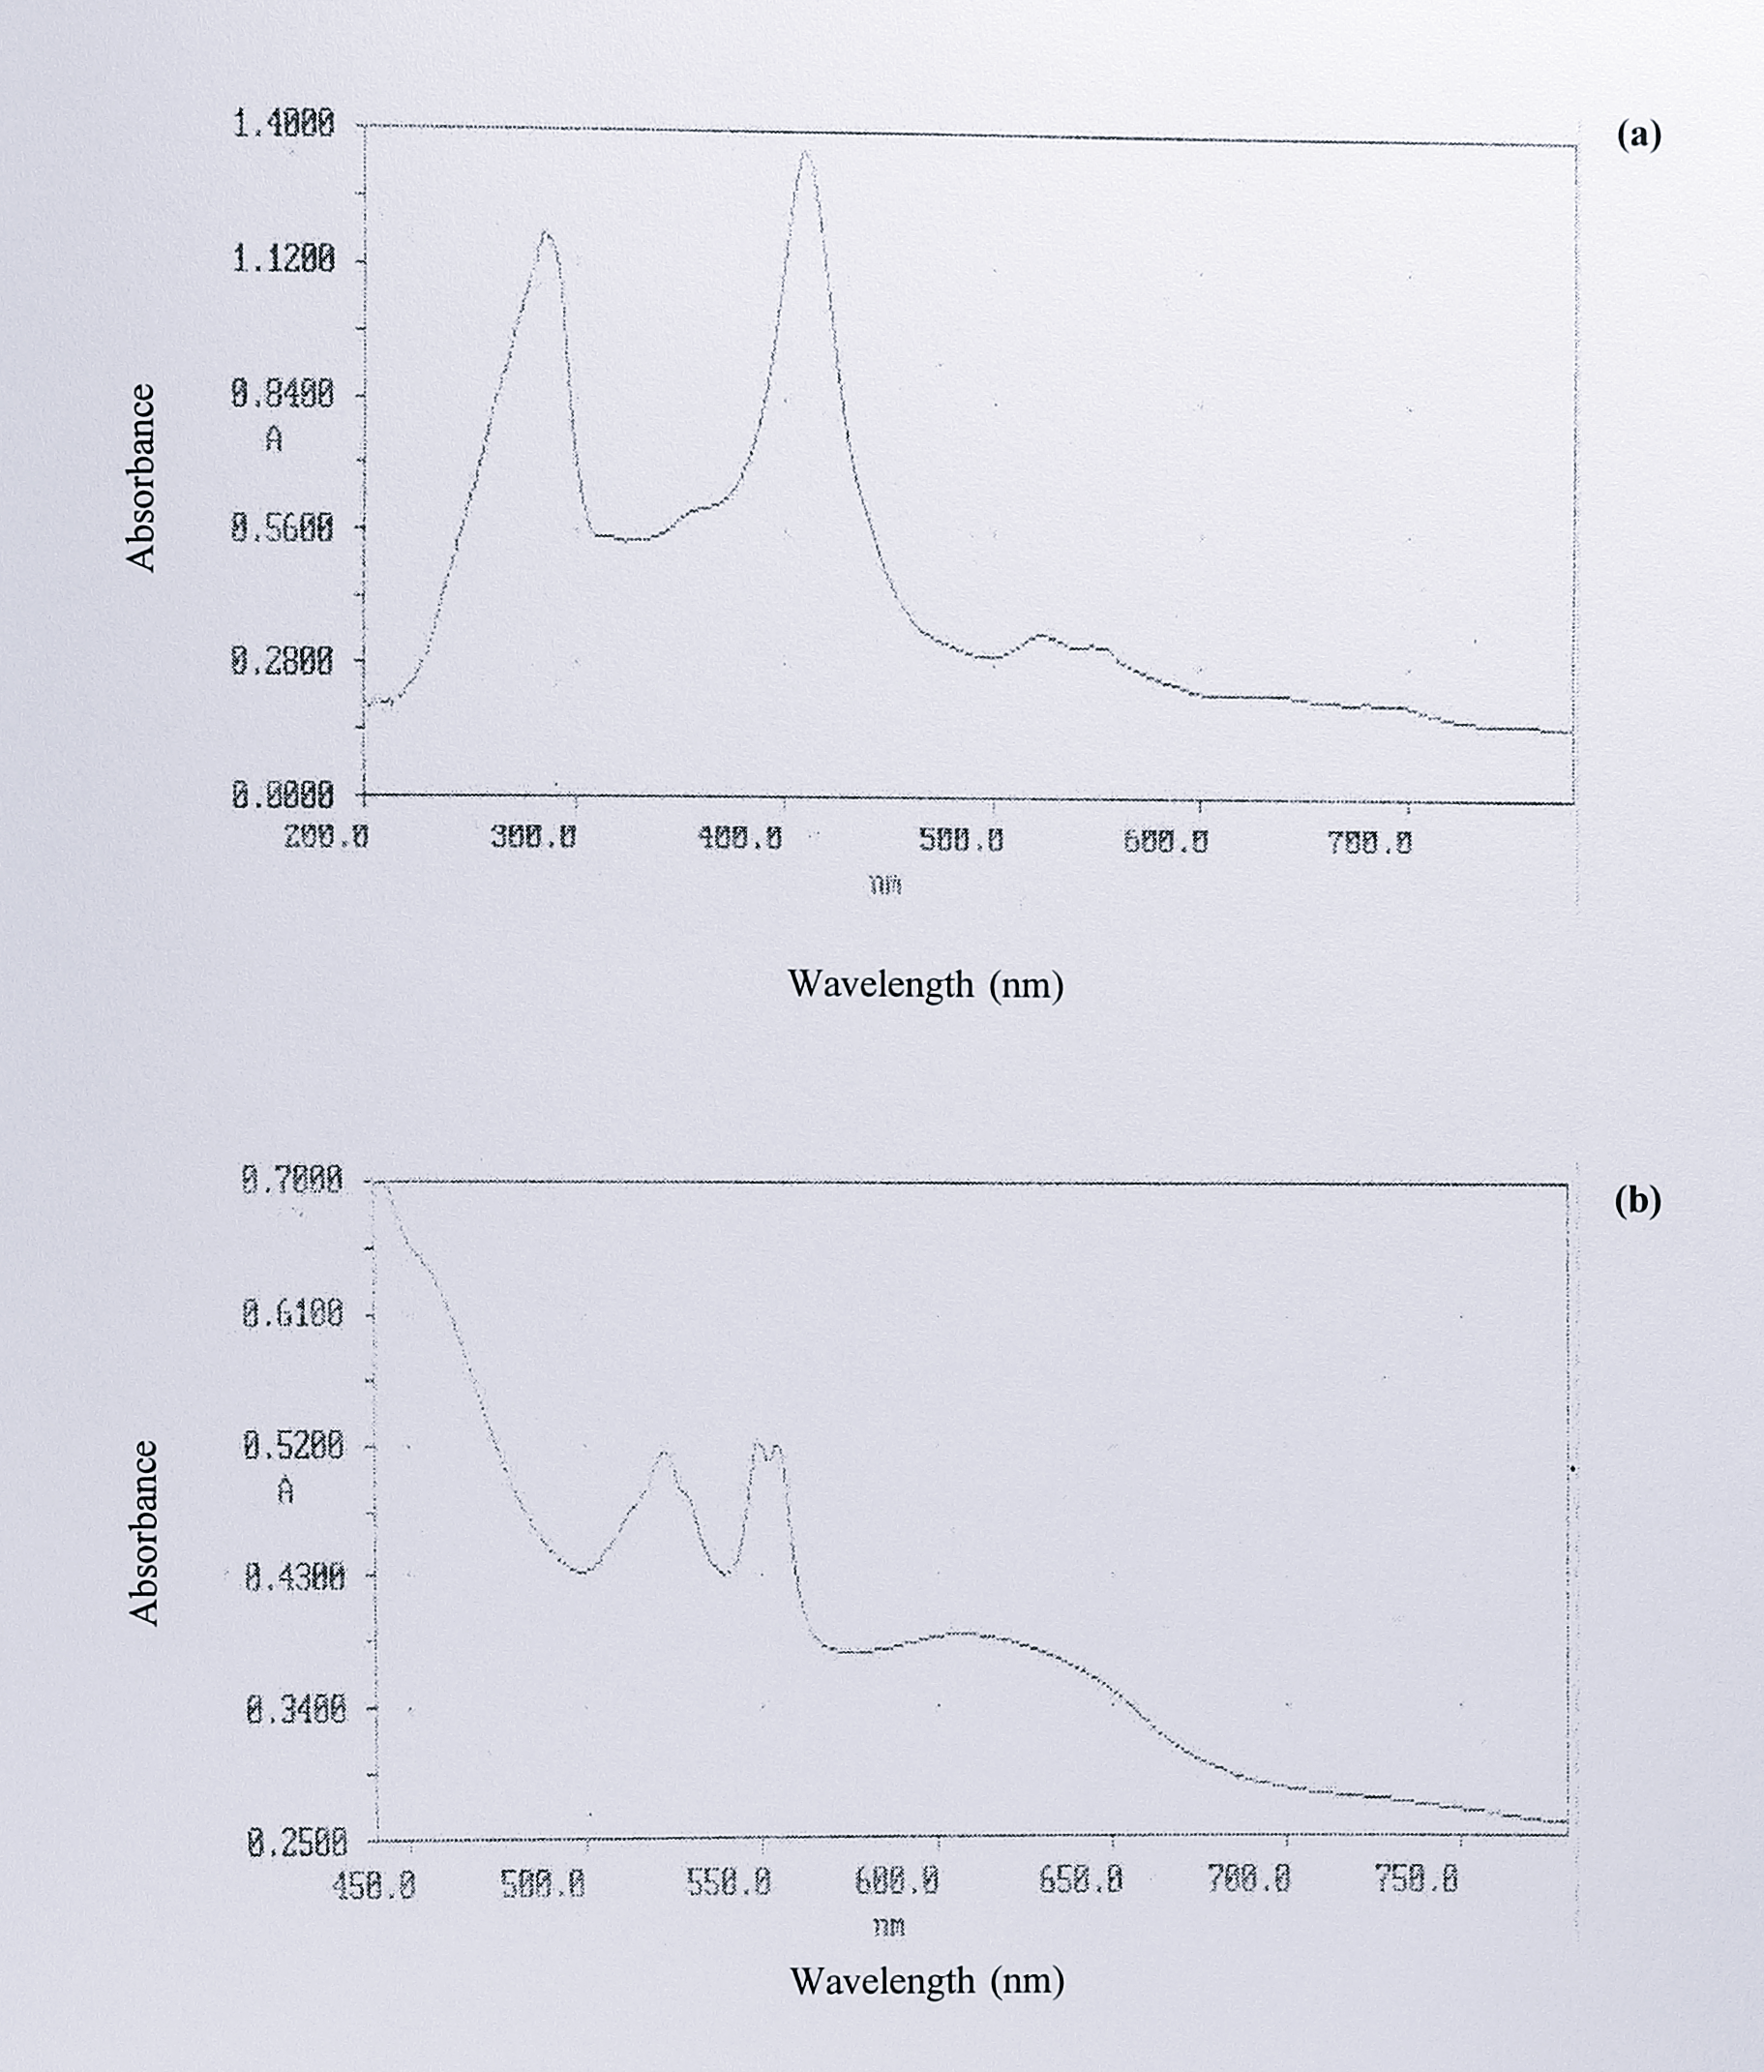
Figure 5.10: (a) UV-visible spectrum of concentrated fractions eluting under peak 3 after DEAE-Sepharose chromatography, as isolated and (b) after the addition of excess sodium dithionite. Five fractions from the top of peak 3 (Figure 5.7) were pooled and concentrated to approximately 1 ml by centrifugation in an Amicon-10 microconcentrator. Absorbance maxima were observed at 286, 409, 523 and 547 nm in the as-isolated form, and 418, 522, 548, 554 and 607 nm in the dithionite-reduced form.
Sodium dithionite was gradually added to a 200 \(\mu\)l sample of the concentrated peak 3 fractions and the spectrum was recorded until no further changes were observed. Figure 5.10b shows the final reduced spectrum, with absorbance peaks at 418, 522, 548, 554 and 607 nm, and a shoulder at 460 nm. The spectrum was similar to that of holocytochrome cd\(_1\) from T. pantotropha but not identical; this point is discussed further in the following section. Changes in the spectrum between the as-isolated and dithionite reduced forms are illustrated by a difference spectrum, shown in Figure 5.11a.
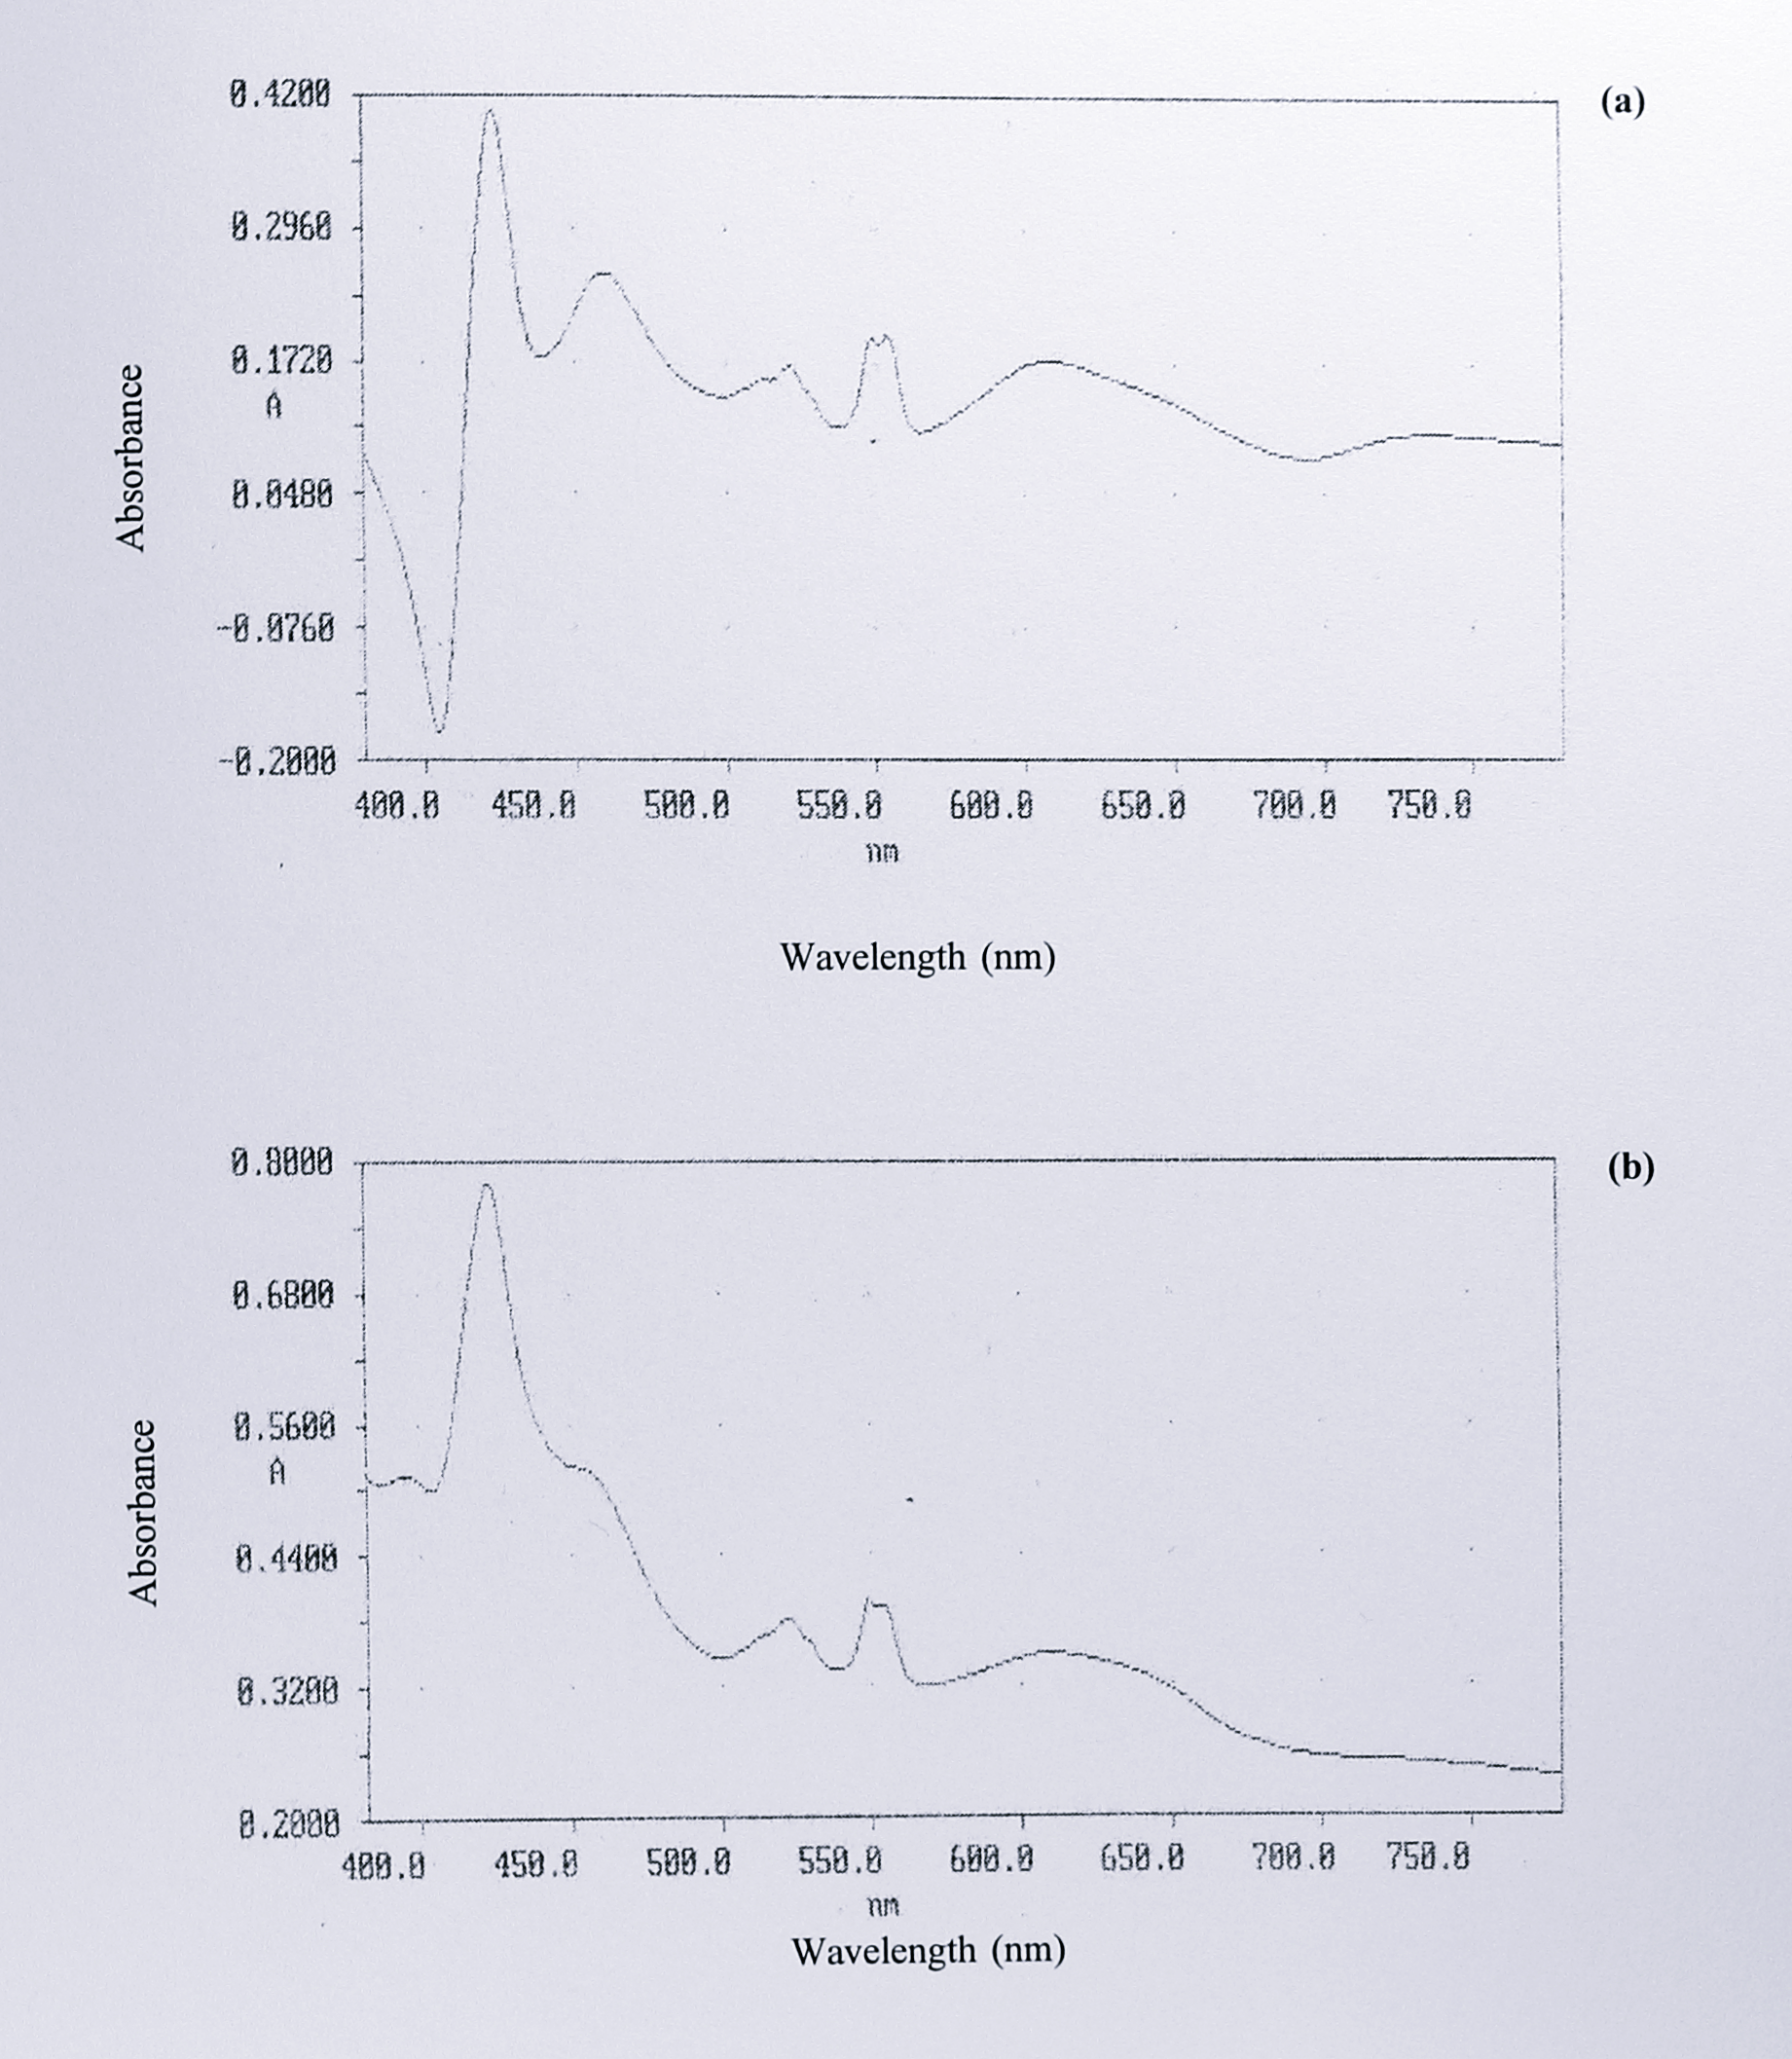
Figure 5.11: Difference spectra of (a) dithionite-reduced minus as-isolated spectra from peak 3 and (b) dithionite-reduced peak 3 minus peak 2. The absolute difference spectra shown in figures 5.9 and 5.10 were subtracted from one another to highlight differences between the reduced and oxidised holo cytochrome (a) and the holo- and semi-apo cytochromes (b). In both cases, difference absorbance maxima appear at 423, 522, 548 and 610 nm. In addition, spectrum (a) shows a peak at 460 nm, which is a pronounced shoulder in spectrum (b).
Major changes in absorbance were noted at 423, 460, 522, 554 and 608 nm. A second difference spectrum of dithionite-reduced peak 3 minus peak 2 is shown in Figure 5.11b. Similar changes were noted, at 423, 522, 548 and 610 nm.
The concentrated material from peaks 2 and 3 was assayed for oxidase activity using horse heart cytochrome c as an electron donor, and for nitrite reductase activity using reduced methyl viologen. Assay traces from these experiments are shown in Figure 5.12.
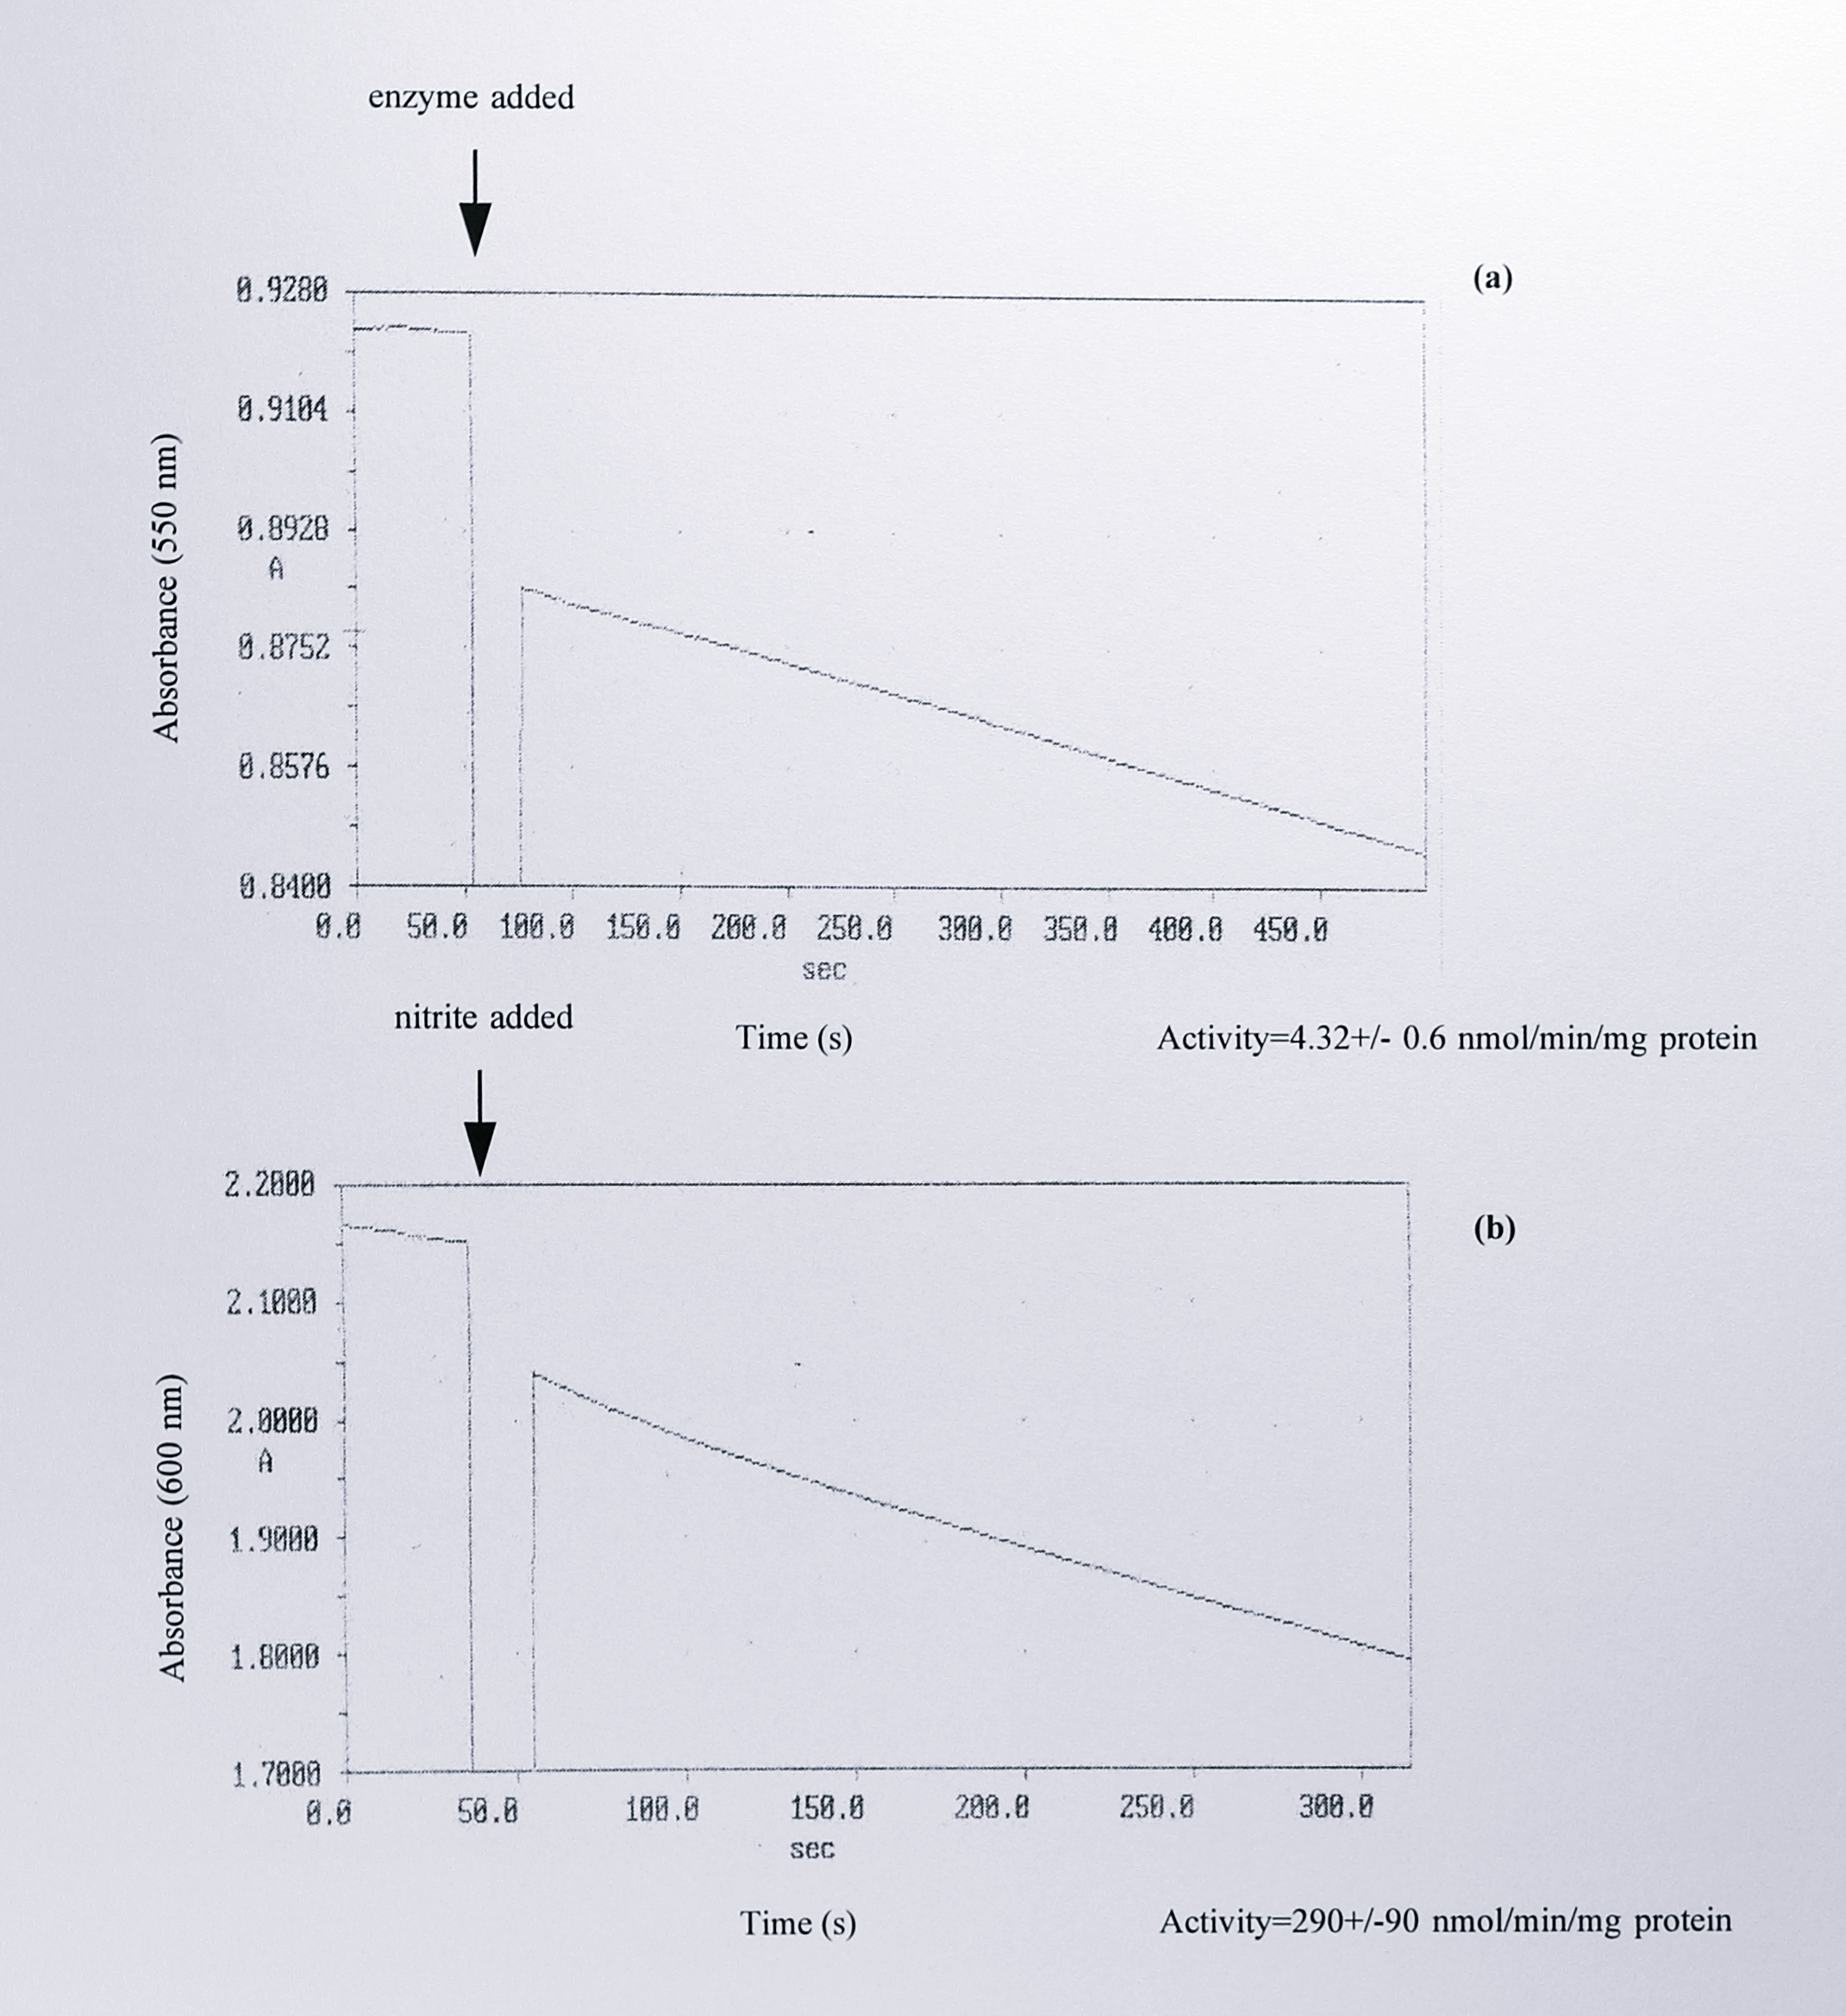
Figure 5.12: (a) Cytochrome c oxidase and (b) nitrite reductase activities of the concentrated fractions from peak 3 following ion exchange chromatography. Samples from peak 3 were assayed for oxidase activity using reduced horse heart cytochrome c as electron donor, and for nitrite reductase activity using reduced methyl viologen as electron donor, as described in Materials and Methods. Beneath each trace are estimates of the activity expressed as nmol of electron donor oxidised per minute per mg of protein, which are the means of three separate assays.
Peak 2 had no activity as either an oxidase or a nitrite reductase. Peak 3 showed a very low oxidase activity of 4.32 +/- 0.6 nmol cytochrome c oxidised per minute per mg of protein. The nitrite reductase activity was higher but was more variable; approximately 290 +/- 90 nmol of methyl viologen was oxidised per minute per mg of protein. Attempts to relate these figures to the turnover number of purified cytochrome cd\(_1\) are discussed in the following section.
5.3 Discussion
Ps aeruginosa PAO1 was chosen as a suitable candidate for expression studies based on the criteria outlined in Section 5.1, one of which was its genetic amenability. It was one of the organisms tested in the original construction of plasmid pMMB67EH [273] and the early experiments in this chapter showed that transformation and plasmid purification from the strain are quite straightforward (Figure 5.1). Having successfully introduced the plasmid into Ps. aeruginosa PAO1, the next objective was to investigate the growth of the transformed cells.
Aerobically, the growth of all cultures was similar, regardless of the presence of nitrate or induction by IPTG (Figure 5.2). This was similar to the result obtained using E. coli JM83 in Chapter 4. However, anaerobically there was a pronounced growth defect in cells carrying pMMBSE regardless of whether IPTG was present. These cultures reached a maximum absorbance at 650 nm of only around 0.6-0.8 compared to around 1.6 in the wild type cultures and entered stationary phase earlier. The cell pellets from anaerobic cultures containing pMMBSE were also much paler when harvested. In E. coli there was some suggestion of an anaerobic growth defect but it was not clear how marked this was, because the combined stress of countering the antibiotic and growing in the minimal medium affected growth regardless of the presence of the nirS gene on the plasmid. The growth of cultures of Ps. aeruginosa containing only pMMB67EH was not tested but even so, the anaerobic growth defect in cultures containing pMMBSE is clearly much more pronounced.
The concentration of nitrite in the culture medium under anaerobic condition was measured, to assess whether a build up of toxic nitrite was responsible for the poor growth of cells containing plasmid pMMBSE. Figure 5.3 shows that in both induced and non-induced cultures of Ps. aeruginosa [pMMBSE], nitrite accumulates to a similar maximum level as seen in the wild-type, but then remains at this concentration, rather than rapidly disappearing from the medium. This indicates that for some reason, nitrite reduction is compromised in cells containing pMMBSE. The haem-stained gel of extracts from each culture under different growth conditions (Figure 5.6) shows that levels of the endogenous cytochrome cd\(_1\) are substantially attenuated in cells containing pMMBSE. It appears that for some reason the presence of the pMMBSE plasmid under anaerobic conditions leads to attenuated expression of the endogenous cytochrome cd\(1\). This in turn prevents the removal of nitrite produced from the nitrate reductase activity of the cells and eventually leads to the premature cessation of growth. The observation also suggests that any activity of the expressed T. pantotropha nirS gene product is not sufficient to lower the nitrite concentration.
As this effect occurs only in cells containing pMMBSE under anaerobic conditions regardless of induction, it is inferred that the effect is linked to a factor on the plasmid which is only active anaerobically. One possible candidate might be the NNR binding site which is present on pMMBSE. Ps. aeruginosa contains at least two proteins of the FNR family, named ANR [299] and DNR [199]. The second of these is in the same phylogenetic group as the NNR protein [169] and could conceivably interact with the NNR binding site, to which it would not normally be exposed. This might reduce levels of the protein and lead to the down-regulation of the endogenous nitrite reductase. However, there are arguments against this interpretation. First, the plasmid pMMBSE is quite low in copy number; the exact number of copies per cell is not known, but is likely to be in the order of 12 copies [300], as the plasmid is based on the RSF1010 replicon. If the DNR (or ANR) molecule is expressed in a similar way to the FNR protein in E. coli, it could be present at around 2 400 copies per cell [301] and so would be unlikely to be titrated out by the plasmid. A fall in free concentration of DNR/ANR under anaerobic conditions might also be expected to be compensated for by autoregulation, which is seen in the case of the FNR gene [183]. However these arguments are based on analogy to FNR and as we know little of how DNR/ANR works there may still be a case for interaction between this molecule and the NNR binding site on pMMBSE, which is not understood at present.
The only other relevant portion of the pMMBSE plasmid is the truncated nirE gene, the first 648 bp of which are present in this construct. This encodes 216 out of a total 287 amino acids and it may be that the truncated protein is expressed under anaerobic growth, so interfering with the normal regulation of denitrification in Ps. aeruginosa and leading to the effects detailed above. Possible effects of the plasmid-borne NNR binding site and the nirE gene could be clarified by control experiments, examining the growth of cultures containing plasmid pMMB67EH, plasmids that carried only the NNR binding site or only the nirS structural gene. The nature of the anaerobic growth defect is, therefore, quite complex and not understood at present, though its main practical consequence is a reduced cell yield, to be taken into account when considering the amount of recombinant cytochrome cd\(_1\) that might be obtained.
Expression of the nirS gene from pMMBSE in Ps. aeruginosa is similar to that seen in E. coli JM83, in that expression only occurs following induction with IPTG, when cells are grown either aerobically or anaerobically. This indicates that the T. pantotropha nirS promoter is non-functional in Ps. aeruginosa. Both T. pantotropha [259] and Ps. aeruginosa [302] have a higher genomic G+C content than E. coli, but apparently there is no precedent for a GC-based promoter structure based solely upon a higher G+C genomic content. These results also demonstrate that the tac promoter and the lacI\(^q\) gene are functional in Ps. aeruginosa, a result consistent with previous studies [303,304]. The expressed cytochrome cd\(_1\) is the same size as the native T. pantotropha protein and has c-type haem attached, indicating that as in E. coli, translocation to the periplasm and subsequent processing have occurred normally. When expressed anaerobically a smeared band of high molecular weight was observed by Western blotting, in addition to the cytochrome cd\(_1\) band (Figure 5.5). This appears to be aggregated cytochrome cd\(_1\) rather than a different cross reacting protein; the anti-cytochrome cd\(_1\) antibody is very specific, as shown by its lack of reactivity towards the cytochrome cd\(_1\) of Ps. aeruginosa (and also Ps. stutzeri, not shown). This observation is in agreement with previous immunological studies, in which an antibody to cytochrome cd\(_1\) from Ps. stutzeri ATCC 14405 was found to be almost strain specific, reacting only weakly with the protein from only a very few other strains of Ps. stutzeri [305]. The aggregated material may originate in vivo or during sample boiling prior to SDS-PAGE, but the former explanation appears more likely as this phenomenon was specific to extracts from anaerobically-grown induced cultures. The protein seems to be expressed at a higher level in Ps. aeruginosa compared to E. coli under these conditions and this may contribute to the aggregation problem; aggregation of over-expressed proteins, including those found in the periplasm has been described previously e.g. for T-cell receptor protein [306], insulin-like growth factor-1 [307] and anti-influenza neuraminidase antibody NC41 [308].
Attempts to partially purify recombinant cytochrome cd\(_1\) from Ps. aeruginosa PAO1 proved to be quite challenging. To begin with the cells cannot be spheroplasted in the normal way to release the periplasm, as they are prone to lysis in the presence of EDTA. Other attempts at spheroplasting that omitted EDTA or used a washing step with 0.2 M MgCl\(_2\) [309] yielded an extract with an extremely pale colour and so it was decided to begin the purification with a total soluble extract from sonicated cells. However, extract from anaerobically grown cells could not be eluted cleanly from a small DEAE Sepharose ion exchange column. The flow rate under these circumstances was very uneven and a resolved elution profile was not obtainable. This occurred several times, even after extensive ultracentrifugation of the extract. It was assumed initially that the aggregated material seen by Western blotting might be causing a blockage in the column, leading to the uneven elution observed. Other possible causes include the presence of polysaccharide or nucleic acids in the sample. The use of a small column (1 x 10 cm) may have contributed to the poor resolution, due to disturbances in the flow caused by surface-tension effects across the narrow column diameter. However, this did not seem to be a major problem during purification of soluble extract from E. coli JM83 (see Figure 4.12, Chapter 4), or during other purifications.
To alleviate the possible effects of all the factors outlined above, a number of changes were made to the procedure. First, Ps. aeruginosa PAO1 [pMMBSE] was grown and induced aerobically in the presence of 50 mM potassium nitrate. The rationale for this approach was that the protein is expressed aerobically following induction as shown by Western blotting but the aggregated material is not observed and, additionally, it is been shown that the presence of nitrate under aerobic conditions in Ps. aeruginosa is sufficient to promote the synthesis of active holocytochrome cd\(_1\) (and therefore d\(_1\) haem [217]. Cultures of 1 l volume were grown in 5 l flasks at a low shaking rate in the hope that this would lower the oxygen tension to some degree, increasing the expression of nitrite reductase but preventing aggregation. Additionally, the cells were lysed by a lysozyme freeze-thaw treatment to reduce polysaccharides and after centrifugation, the viscous supernatant was treated with DNase and filtered. Finally the column diameter was increased to 2 cm and the gradient was run against gravity to improve resolution [236]. The orange-brown soluble extract obtained was bound to the column, washed and eluted and this time an even flow rate was observed with a clean, well-resolved elution profile exhibiting three peaks (Figure 5.7). Haem-staining of the fractions from the top of each peak showed that peaks 2 and 3 contained a c-type cytochrome with the same mobility as the native cytochrome cd\(_1\) from T. pantotropha (Figure 5.11). This is what would be expected were the cytochromes to be semi-apo (peak 2) and holo- (peak 3) cytochrome cd\(_1\); the latter protein elutes at around 250 mM NaCl, with the semi-apo protein eluting slightly earlier on anion exchange columns. A haem-stained sample of total extract from this culture (lane 1) shows clearly that the cytochromes from peaks 2 and 3 correspond to the band that appears in this culture on induction with IPTG, which is slightly higher than the endogenous cytochrome cd\(_1\) band. It was therefore clear that both peaks, 2 and 3, contained recombinant T. pantotropha cytochrome cd\(_1\).
Spectroscopy was used to characterise further the proteins from each of the three peaks. Peak 1 exhibited a broad peak at 405 nm as isolated, and two peaks at 425 and 557 nm in the dithionite-reduced form. These features indicate a haem-containing protein, possibly a b- or c-type cytochrome. The sample was not investigated further. Peak 2 exhibited absorbance maxima that identified it as being semi-apo cytochrome cd\(_1\). The spectrum was virtually identical to that of the recombinant semi-apo cytochrome cd isolated from E. coli JM83 (Chapter 4) and to that of the chemically-prepared semi-apo protein in the reduced state. Peak 3 had a stronger A\(_{410}\) absorbance than peak 2. The spectrum of the pooled fractions from the peak (Figure 5.9a) exhibited peak absorbances at 409, 523, 547 and 628 nm. Overall, the spectrum resembled cytochrome cd\(_1\) in the oxidised state, but the slight (red-shift) of the c-haem \(\beta\) and \(\gamma\) bands and the small absorbance at 547 nm indicated that a small proportion of the enzyme was reduced. Absorbance in the 600-700 nm region was small but significant, indicating the presence of d\(_1\) haem.
Several small additions of sodium dithionite resulted in a gradual reduction of the protein and the final recorded spectrum is shown in Figure 5.9b. This spectrum had peak absorbances at 418, 522, 548, 554 and 607 nm. There was a pronounced shoulder at 460 nm and the absorbance peak of 607 nm was quite broad, spreading across the 600-650 nm region. These features are again quite similar to the cytochrome cd\(_1\) holoprotein in the reduced form, but there are some significant differences; in Figure 5.9b the absorbance at 460 nm is attenuated compared to the native protein. Also, the absorbance in the 600-650 nm region is different, with the peak absorbance significantly blue-shifted and comprising a single broad absorbance. However, difference spectra of the reduced minus as-isolated material from peak 3 (Figure 5.10a) and of the reduced peak 3 minus peak 2 (Figure 5.10b) indicate that the changes in the reduced spectrum of material from peak 3 have occurred in regions where d\(_1\) haem absorbs, at 460 nm and in the 600-650 nm region.
Table 5.2 shows the ratios of some of the peak absorbances in the spectra of the semiapo- and putative holocytochrome cd\(_1\) expressed in Ps. aeruginosa, compared with the native protein from T. pantotropha.
| Absorbance ratio | T. pantotropha holoprotein, reduced | Ps. aeruginosa recombinant holoprotein, reduced | T. pantotropha chemically-prepared semi-apoprotein, reduced | Ps. aeruginosa recombinant semi-apoprotein, reduced | E. coli recombinant semi-apoprotein, reduced |
|---|---|---|---|---|---|
| 418:522 | 7.48 | 2.92 | 2.72 | 6.16 | 5.73 |
| 418:548 | 6.60 | 2.88 | 2.69 | 6.59 | 5.72 |
| 418:554 | 6.68 | 2.90 | 2.67 | 6.50 | 5.62 |
| 418:650 | 8.06 |
|
|
|
|
| 522:548 | 0.88 | 0.99 | 0.99 | 1.07 | 1.00 |
| 522:554 | 0.89 | 0.99 | 0.98 | 1.06 | 0.98 |
| 522:650 | 1.08 |
|
|
|
|
| 548:554 | 1.01 | 1.01 | 0.99 | 0.99 | 0.98 |
| 548:650 | 1.22 |
|
|
|
|
| 554:650 | 1.21 |
|
|
|
|
| 418:607 |
|
3.87 |
|
|
|
| 522:607 |
|
1.32 |
|
|
|
| 548:607 |
|
1.34 |
|
|
|
| 554:607 |
|
1.34 |
|
|
|
These data indicate that the c haem:d\(_1\) haem ratio is somewhat lower in the expressed material. One explanation for this is that the material is not spectroscopically pure and may be contaminated with some semi-apo protein because of incomplete resolution of peaks 2 and 3. However, the peaks appear quite well separated in the elution profile (Figure 5.7) and spectroscopic analysis of the later fractions from peak 3 before concentration gave similar results to those obtained after concentration (not shown). A second explanation is that d\(_1\) haem incorporation differs somewhat in the expressed protein and this is supported to some extent by analysis of the activity of the expressed protein. As expected, peak 2, the recombinant semi-apo cytochrome cd\(_1\) shows neither oxidase or nitrite reductase activity, in the absence of the d\(_1\) haem. However, the recombinant holocytochrome cd\(_1\) has an oxidase activity of around 4.3 nmol cytochrome c oxidised per minute per mg of protein. Using the extinction coefficient determined for native cytochrome cd\(_1\) at 548 nm, this converts to a turnover number of approximately 0.64 min\(^{-1}\). Purified native cytochrome cd\(_1\) from T. pantotropha assayed under the same conditions gave a turnover number of approximately 3 min\(^{-1}\). In contrast, the nitrite reductase activity seemed less affected in the expressed protein; although these assays were more variable, a turnover number of around 60 min\(^{-1}\) was calculated for the expressed protein, compared to about 124 min\(^{-1}\) for the native protein. However, it may not be appropriate to use the extinction coefficients determined for the native protein in these circumstances, due to the spectroscopic changes observed in the recombinant material and indeed, using different peak absorbances for these calculations gives different estimates of cytochrome cd\(_1\) concentration. An approximate idea of cytochrome cd\(_1\) concentration might be obtained from measuring the protein concentration of a pure sample, though in this case not enough material was obtained for further purification. The most reasonable summary of these results is that the recombinant protein has both oxidase and nitrite reductase activities, which appear to be somewhat lower than those of the native protein, while spectroscopic features that indicate the presence of d\(_1\) haem but suggest that it is not bound in an identical fashion to that seen in the native protein. Inefficient d\(_1\) haem incorporation may also explain why some of the recombinant material was expressed as the semi-apo protein, though it may also be that under the semi-aerobic growth conditions, insufficient d\(_1\) haem was produced to complex with all of the expressed polypeptide.
The observed differences between the expressed and native holocytochromes cd\(_1\) may result from improper interactions between the expressed polypeptide and the biosynthetic apparatus for cytochrome cd\(_1\) in Ps. aeruginosa. Although several homologous genes involved in cytochrome cd\(_1\) biosynthesis have been identified in Ps. aeruginosa, Ps. stutzeri and P. denitrificans, the specific genes found in each organism and their physical arrangement differs [168] and it is likely that each system is adapted to its own specific cytochrome cd\(_1\) polypeptide to some degree. Another possibility is that under semi-aerobic conditions a proportion of the haem inserted in to the expressed protein is not of the d\(_1\) type, but some other haem. Ps. aeruginosa synthesises a number of haem molecules including haems o [310], a\(_3\) and a [311], the latter of which was shown to insert into semi-apo cytochrome cd\(_1\) in vitro and result in a low oxidase activity [118]. Alternative haems might be identifiable by organic extraction and spectroscopy of the haem group; this was attempted on a small amount of the expressed protein but was inconclusive, again due to the small amounts of material obtained. However, it seems more likely that the protein contains d\(_1\) haem that is bound differently from the native protein, as the observed absorbances were in the correct positions for haem d\(_1\), if not identical to the native protein, and the colours of the expressed and native proteins were similar. Notably, incomplete reconstitution of the recombinant semi-apo protein from E. coli produces cytochrome cd\(_1\) in which the d\(_1\) haem absorbance features observed in the present chapter (a broad absorbance at 600-650 nm with a blue shifted peak and an attenuated 460 nm peak) are also observed.
The experiments described in this chapter suggest that Ps. aeruginosa is of some use as a heterologous host for expression of cytochrome cd\(_1\) from T. pantotropha, but there are disadvantages. The recombinant protein had some activity, which indicates that the system could be used to determine whether mutants of cytochrome cd\(_1\) possessed activity when compared with the native protein. However, the apparent differences in the spectrum of the expressed protein and in its activity, as compared with the native protein, warrant further investigation. Additionally, the comments from Chapter 4 pertaining to methods of improving the levels of expression apply here, as it would be advantageous to obtain more material for further purification and subsequent analysis. These experiments show that the method of using a denitrifying heterologous host for expression is a valid one, and it may also be possible to try expression in other hosts, such as Ps. stutzeri or A. eutrophus. The latter approach may also be advantageous as Ps. aeruginosa is an opportunistically pathogenic organism that requires some care in handling and, as a further practical consideration, requires the use of high concentrations of carbenicillin, an expensive antibiotic, to maintain the plasmid pMMBSE.