Chapter 6 Construction of an unmarked deletion in the nirS gene of T. pantotropha: complementation of the mutant and expression of a site-directed mutant of cytochrome cd\(_1\) nitrite reductase
6.1 Introduction
In the previous two chapters, expression of the cloned nirS gene from T. pantotropha was investigated in the heterologous hosts E. coli and Ps. aeruginosa. In each of these cases holo cytochrome cd\(_1\) could be obtained, either by reconstitution in vitro with haem d\(_1\) in the former case or by expression under denitrifying conditions in the latter. It was seen that neither of these approaches were ideal in terms of both the uniformity of the material obtained and the difficulties in comparing the expressed material to the wild-type protein. The experiments in this chapter therefore focus on a third possible expression system, utilising a mutant of T. pantotropha in which part of the nirS gene has been deleted. Such mutants would not synthesise cytochrome cd\(_1\) nitrite reductase and would not be expected to grow well under anaerobic conditions, using nitrate as a terminal electron acceptor, because the nitrite that would accumulate in the absence of cytochrome cd\(_1\) is toxic. In theory it should be possible to complement the mutants using the nirS gene on a plasmid and restore growth on nitrate. However, there are three possible problems to consider using this approach: first, over-expression of the plasmid-borne nirS gene may interfere with the normal regulation of denitrification in the cell (for instance by out-stripping the supply of haem d\(_1\) to the polypeptide), second, disruption of the nirS gene may adversely affect d\(_1\) haem biosynthesis and third, expression of inactive mutants of cytochrome cd\(_1\) will not restore growth on nitrate to the cells which will die because of the build-up of nitrite.
The experiments described in this chapter fall into three sections. In the first part the construction of two mutagenic plasmids is described; these are used to insert a kanamycin marker cassette upstream of the nirS gene and then to construct the unmarked deletion in the gene itself. The second part of the chapter concentrates on the analysis of this mutant and its complementation using the cloned nirS gene. Finally, in part three, attempts to express the first site-directed mutant of cytochrome cd\(_1\) in which Tyr-25 is replaced with phenylalanine are described.
6.2 Results
6.2.1 Construction of mutagenic plasmids and of the unmarked deletion mutant in the nirS gene
The methods used to construct an unmarked deletion in the nirS gene of T. pantotropha were developed by van Spanning (1991) [312]. To create the deletion two mutagenesis steps were used. First, a kanamycin resistance marker was inserted upstream of the nirS gene cloned in the suicide plasmid pGRPd1. The plasmid was then mobilised into T. pantotropha and cells in which the marker had inserted into the chromosome by homologous recombination were selected. This procedure is outlined in Figure 6.1.
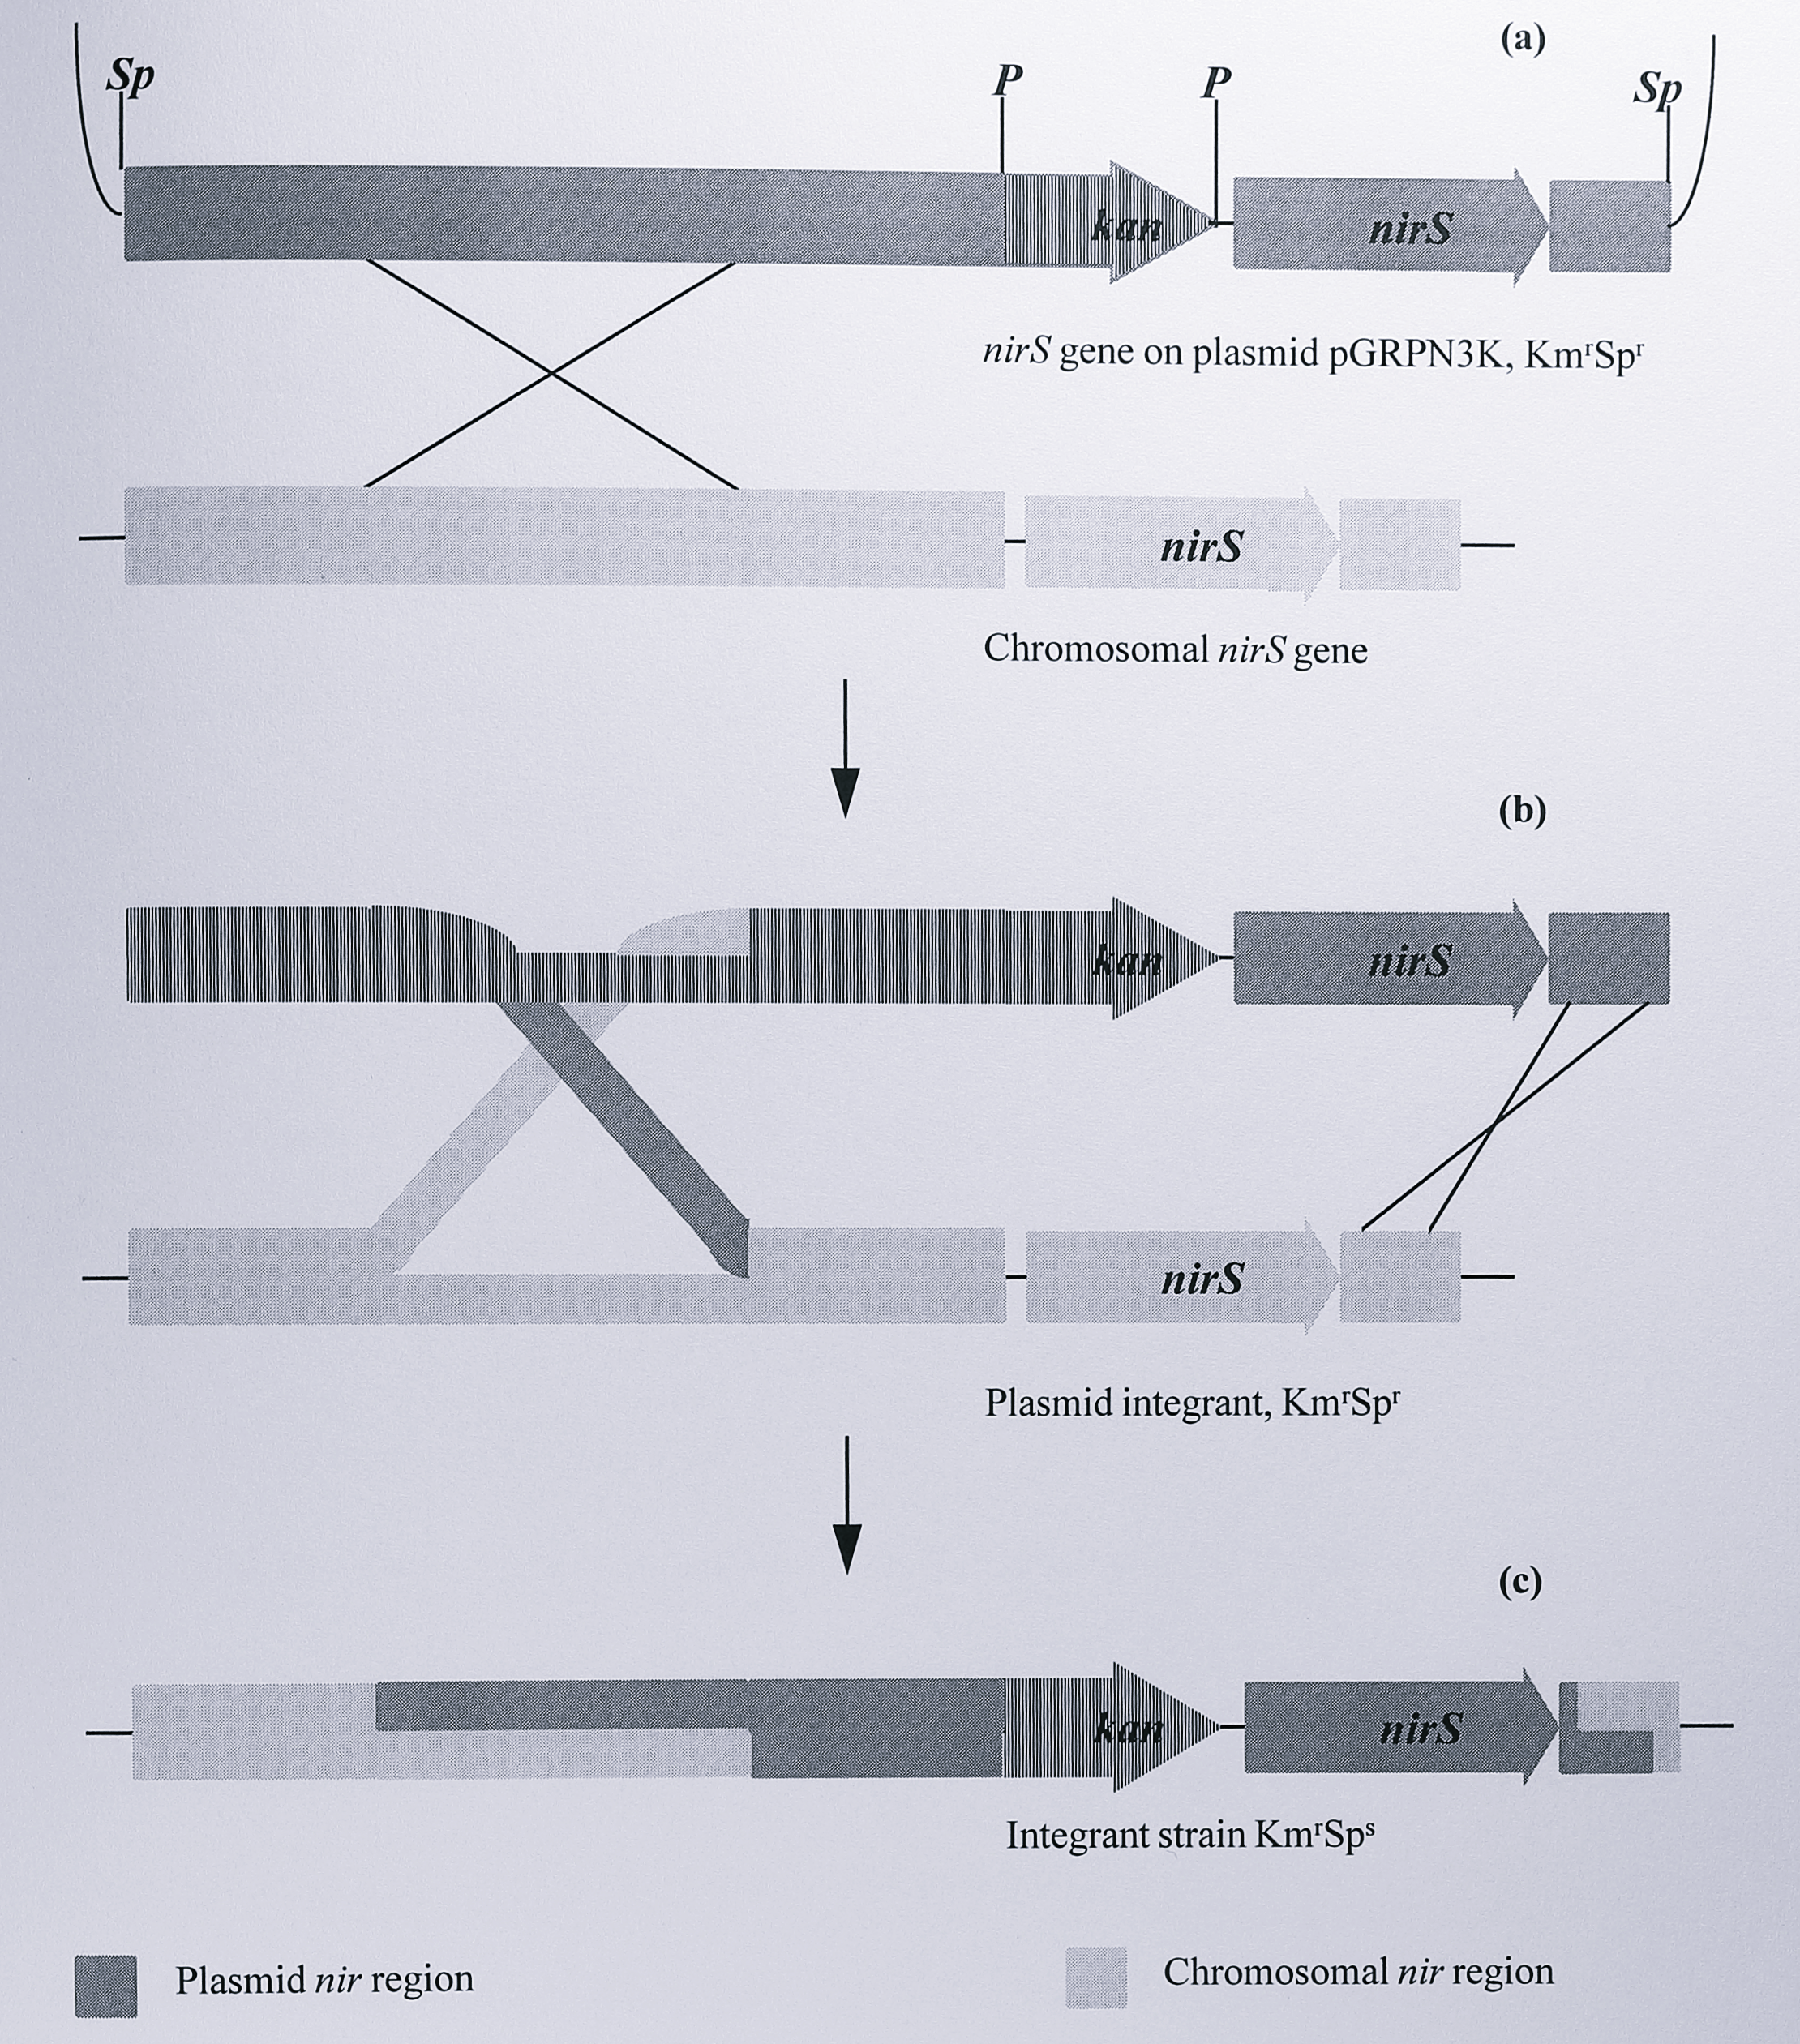
Figure 6.1: Construction of a kanamycin insertional mutant in the nir region of the T. pantotropha genome. (a) Plasmid pGRPN3K (Table 6.1) is introduced into the cell and undergoes a single homologous recombination with the nir region of the chromosome. (b) This results in a plasmid integrant strain which is both kanamycin- and spectinomycin resistant due to the spectinomycin resistance gene on the vector. (c) A second homologous recombination results in integration of the kan gene upstream of the nirS gene and loss of the spectinomycin resistance determinant on the suicide plasmid. Enzymes: P, PstI, Sp, SphI.
In the second step, a copy of the nirS gene from which a fragment had been deleted was cloned into a second suicide plasmid, pRVS1. This construct was then mobilised into the strain of T. pantotropha carrying the kanamycin marker and cells in which the marker and the wild-type nirS gene were replaced by the copy carrying the deletion were selected. This step is outlined in Figure 6.2.
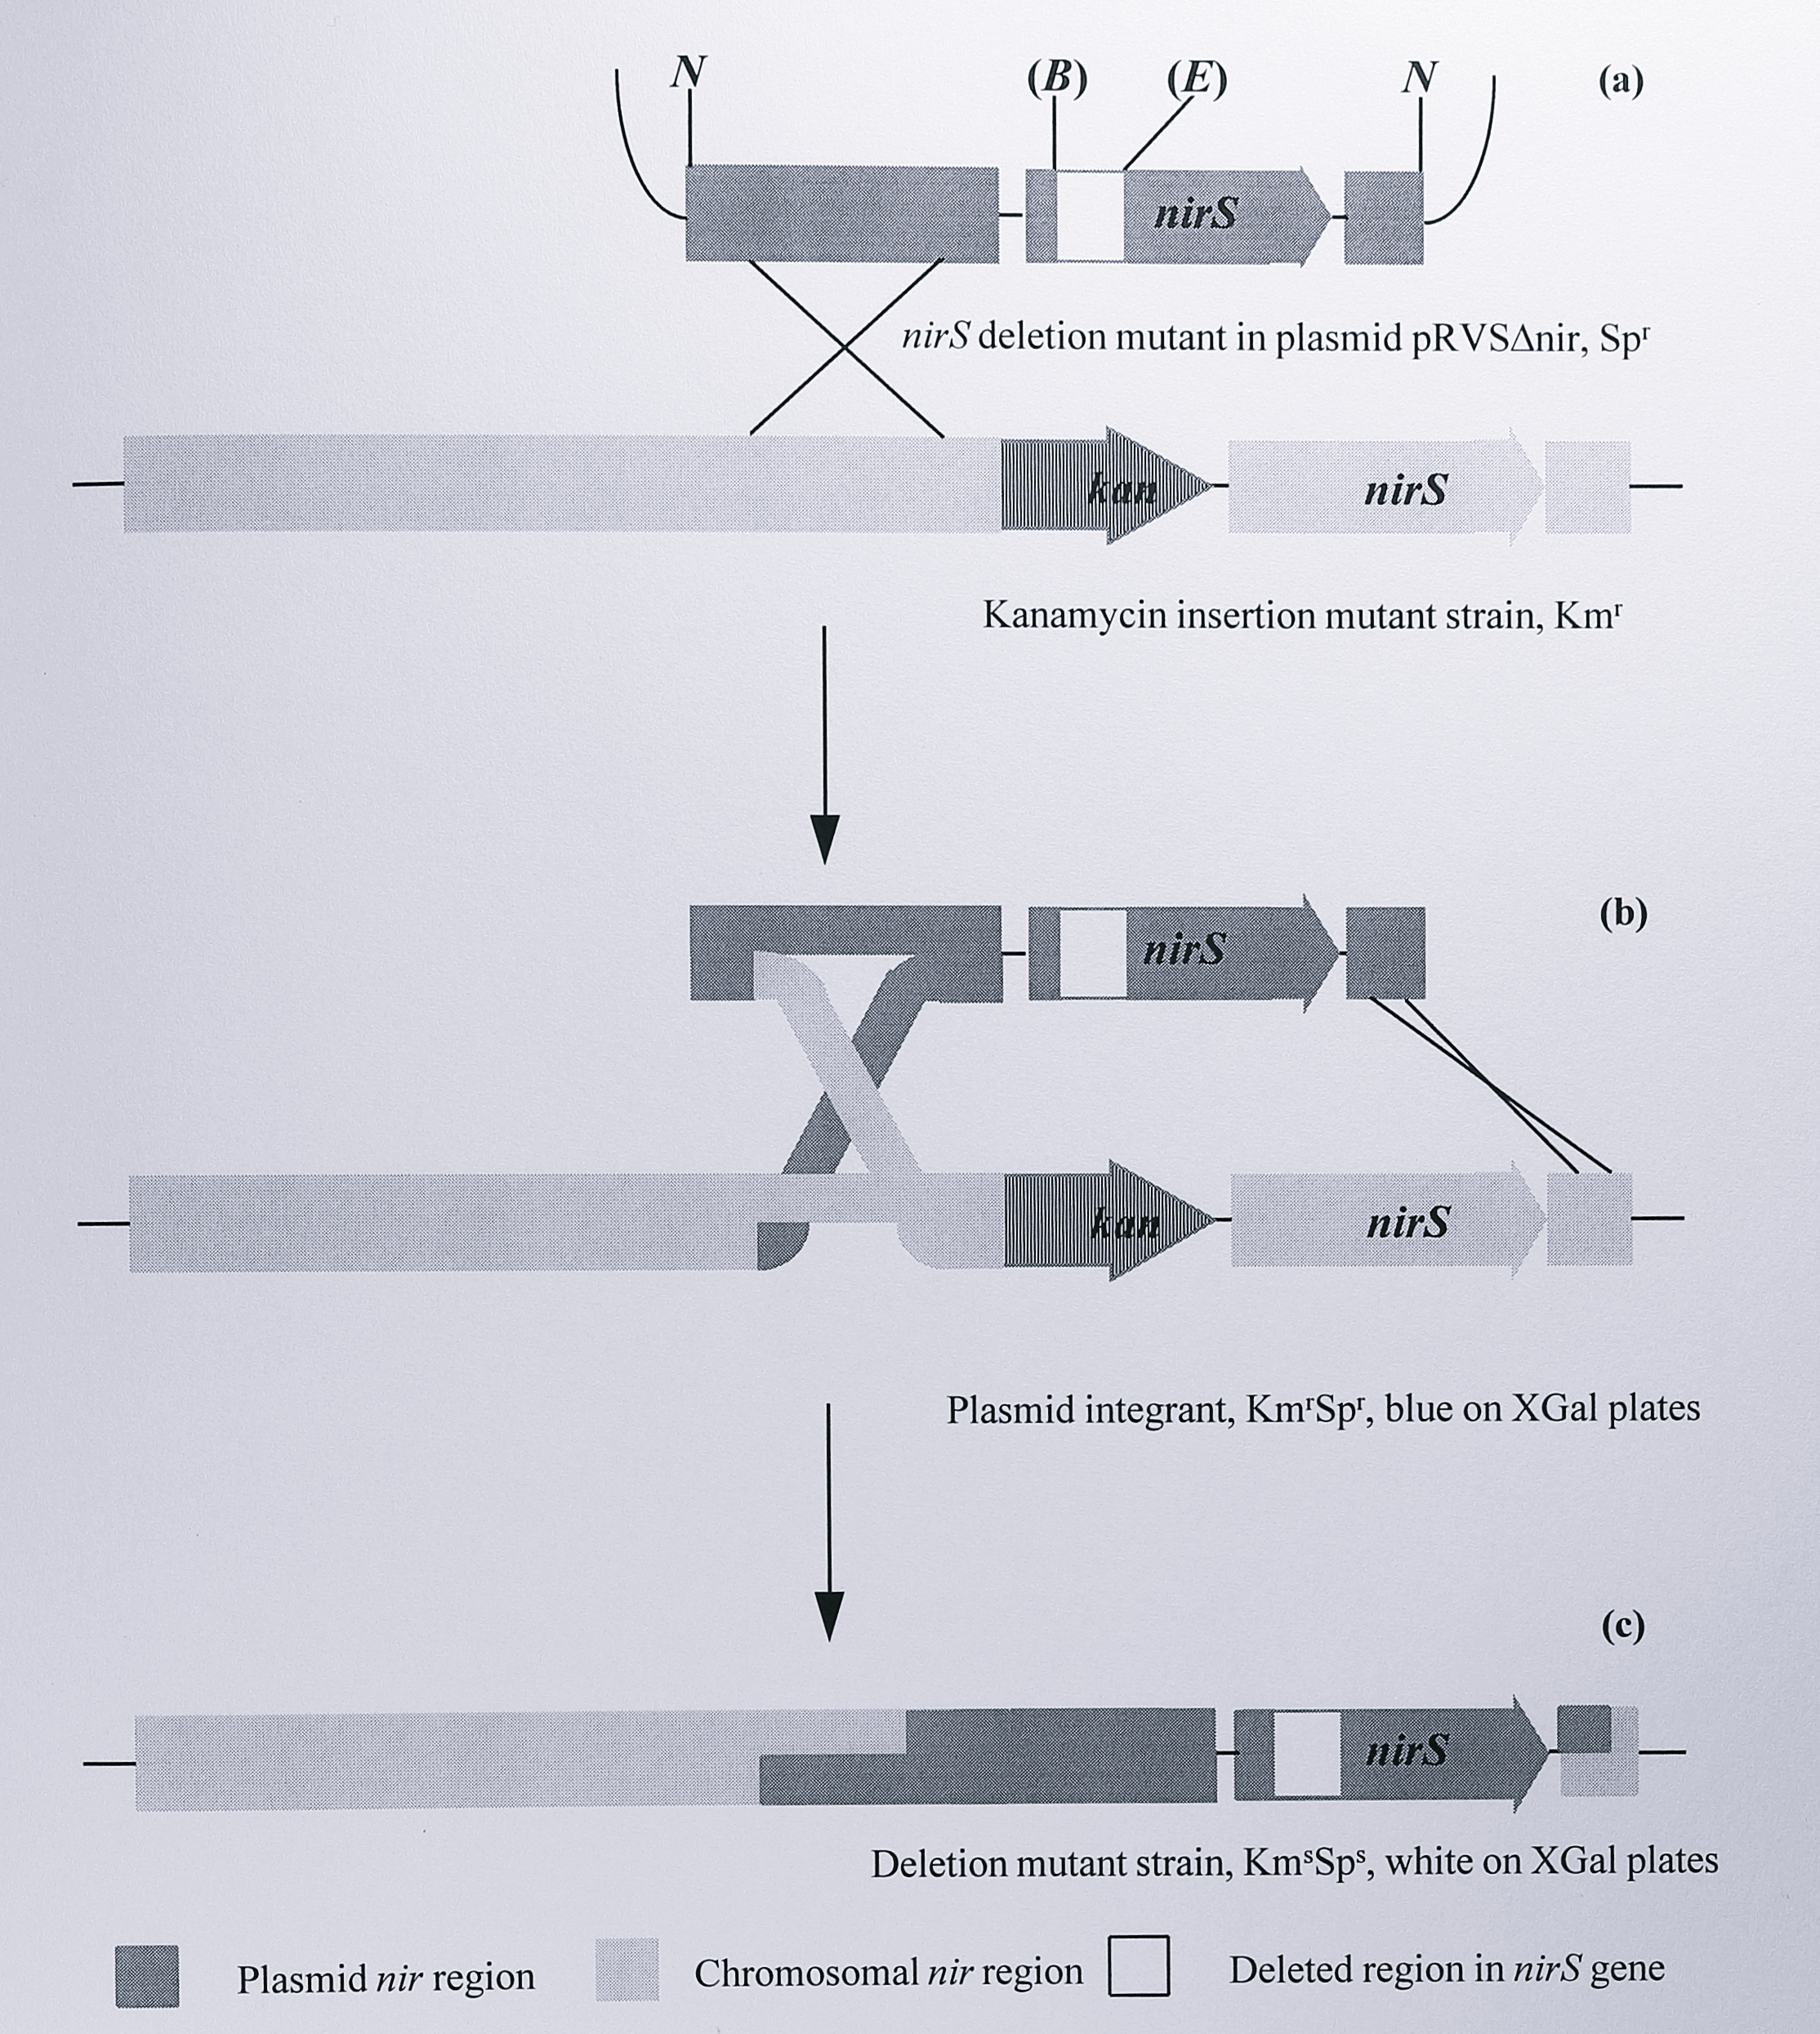
Figure 6.2: Construction of a nirS deletion mutant strain in T. pantotropha. (a) Plasmid pRVS\(\Delta\)nir (Table 6.1) is introduced into the cell and undergoes a single homologous recombination with the nir region of the chromosome. (b) This results in a plasmid integrant strain which is kanamycin- and spectinomycin resistant and colours blue on XGal plates due to the lacZ gene on the vector. (c) A second homologous recombination removes the kan gene from the chromosome and inserts the cloned nirS gene which contains the deletion. The lacZ and spectinomycin resistance genes are lost on the suicide plasmid. Enzymes: (B), (E) 382 bp BamHI - EcoRI fragment removed, ends blunted and religated. N, NotI.
The plasmids and strains of T. pantotropha constructed in this study are described in Table 6.1.
| Plasmid name | Description | Source or reference |
|---|---|---|
| pUC4K | Kanamycin resistance gene (kan) from Tn903 cloned in pUC4 | Pharmacia |
| pGEM5zf(+) | General purpose cloning vector | Promega |
| pGRPd1 | 6.7 kbp suicide vector | Van Spanning et al. (1990) [313] |
| pRVS1 | 11.6 kbp suicide vector containing lacZ gene for blue-white selection of plasmid integrants; used for construction of umarked deletion in nirS | Van Spanning et al. (1991a) [314] |
| pMMB67EH | 8.8 kbp broad host range expression vector | Fürste et al. (1986) [273] |
| pALTER-1 | Cloning vector for site-directed mutagenesis using Altered Sites II system | Promega |
| pTNIR3 | 7.5 kbp SphI fragment, containing the nirS gene and surrounding region cloned in pGEM7zf(+) | Obtained from Thon de Boer, Vrije Universiteit, Amsterdam |
| pBNIR | 2.4 kbp PstI-SphI fragment of pTNIR3 containing the nirS gene cloned in pBS(-) | This work (Chapter 4) |
| pTNIR3K | 1.2 kbp fragment of pUC4K containing kan gene cloned upstream of nirS gene in pTNIR3 | This work |
| pGRPN3K | 8.3 kbp SphI fragment of pTNIR3 containing nirS and kan genes cloned in pGRPd1 | This work |
| pLN3N | 4.2 kbp NotI fragment of pTNIR3 containing nirS gene cloned in pGEM5zf(+) | This work |
| pLN3N\(\Delta\)nir | pLN3N with 382 bp BamHI-EcoRI fragment removed from the nirS gene | This work |
| pRVS\(\Delta\)nir | 3.8 kbp NotI fragment from pLN3N\(\Delta\)nir containing nirS gene deletion cloned in SmaI site of pRVS1 | This work |
| pMMBSEK | 3.6 kbp XbaI-SphI fragment of pBNIR containing the nirS gene and kan genes cloned in pMMB67EH | This work (Chapter 4) |
| pVA191-Y25F | 600 bp EcoRI fragment of pBNIR containing the Y25F mutation in nirS cloned in pALTER-1 | This work, obtained from Dr. Simon Baker |
| pLN3NY25F | As pLN3N but with Y25F mutation in the nirS gene | This work |
| pBY25F | 2.4 kbp PstI-NotI fragment of pLN3NY25F containing nirS gene with Y25F mutation cloned in pBluescript II KS(+) | This work |
| pBY25FK | 1.2 kbp PstI fragment of pUC4K containing kan gene cloned in pBY25F | This work |
| pMMBY25F | As pMMBSEK but with Y25F mutation in the nirS gene | This work |
| Strain name | ||
| T. pantotropha K7-K10 | T. pantotropha containing kanamycin resistance gene in promoter region of nirI | This work |
| T. pantotropha \(\Delta5\), \(\Delta7\), \(\Delta8\) | T. pantotropha containing a 382 bp deletion in the nirS gene | This work |
The strategy for construction of the suicide plasmid containing the nirS gene and the kanamycin marker is shown in Figure 6.3.
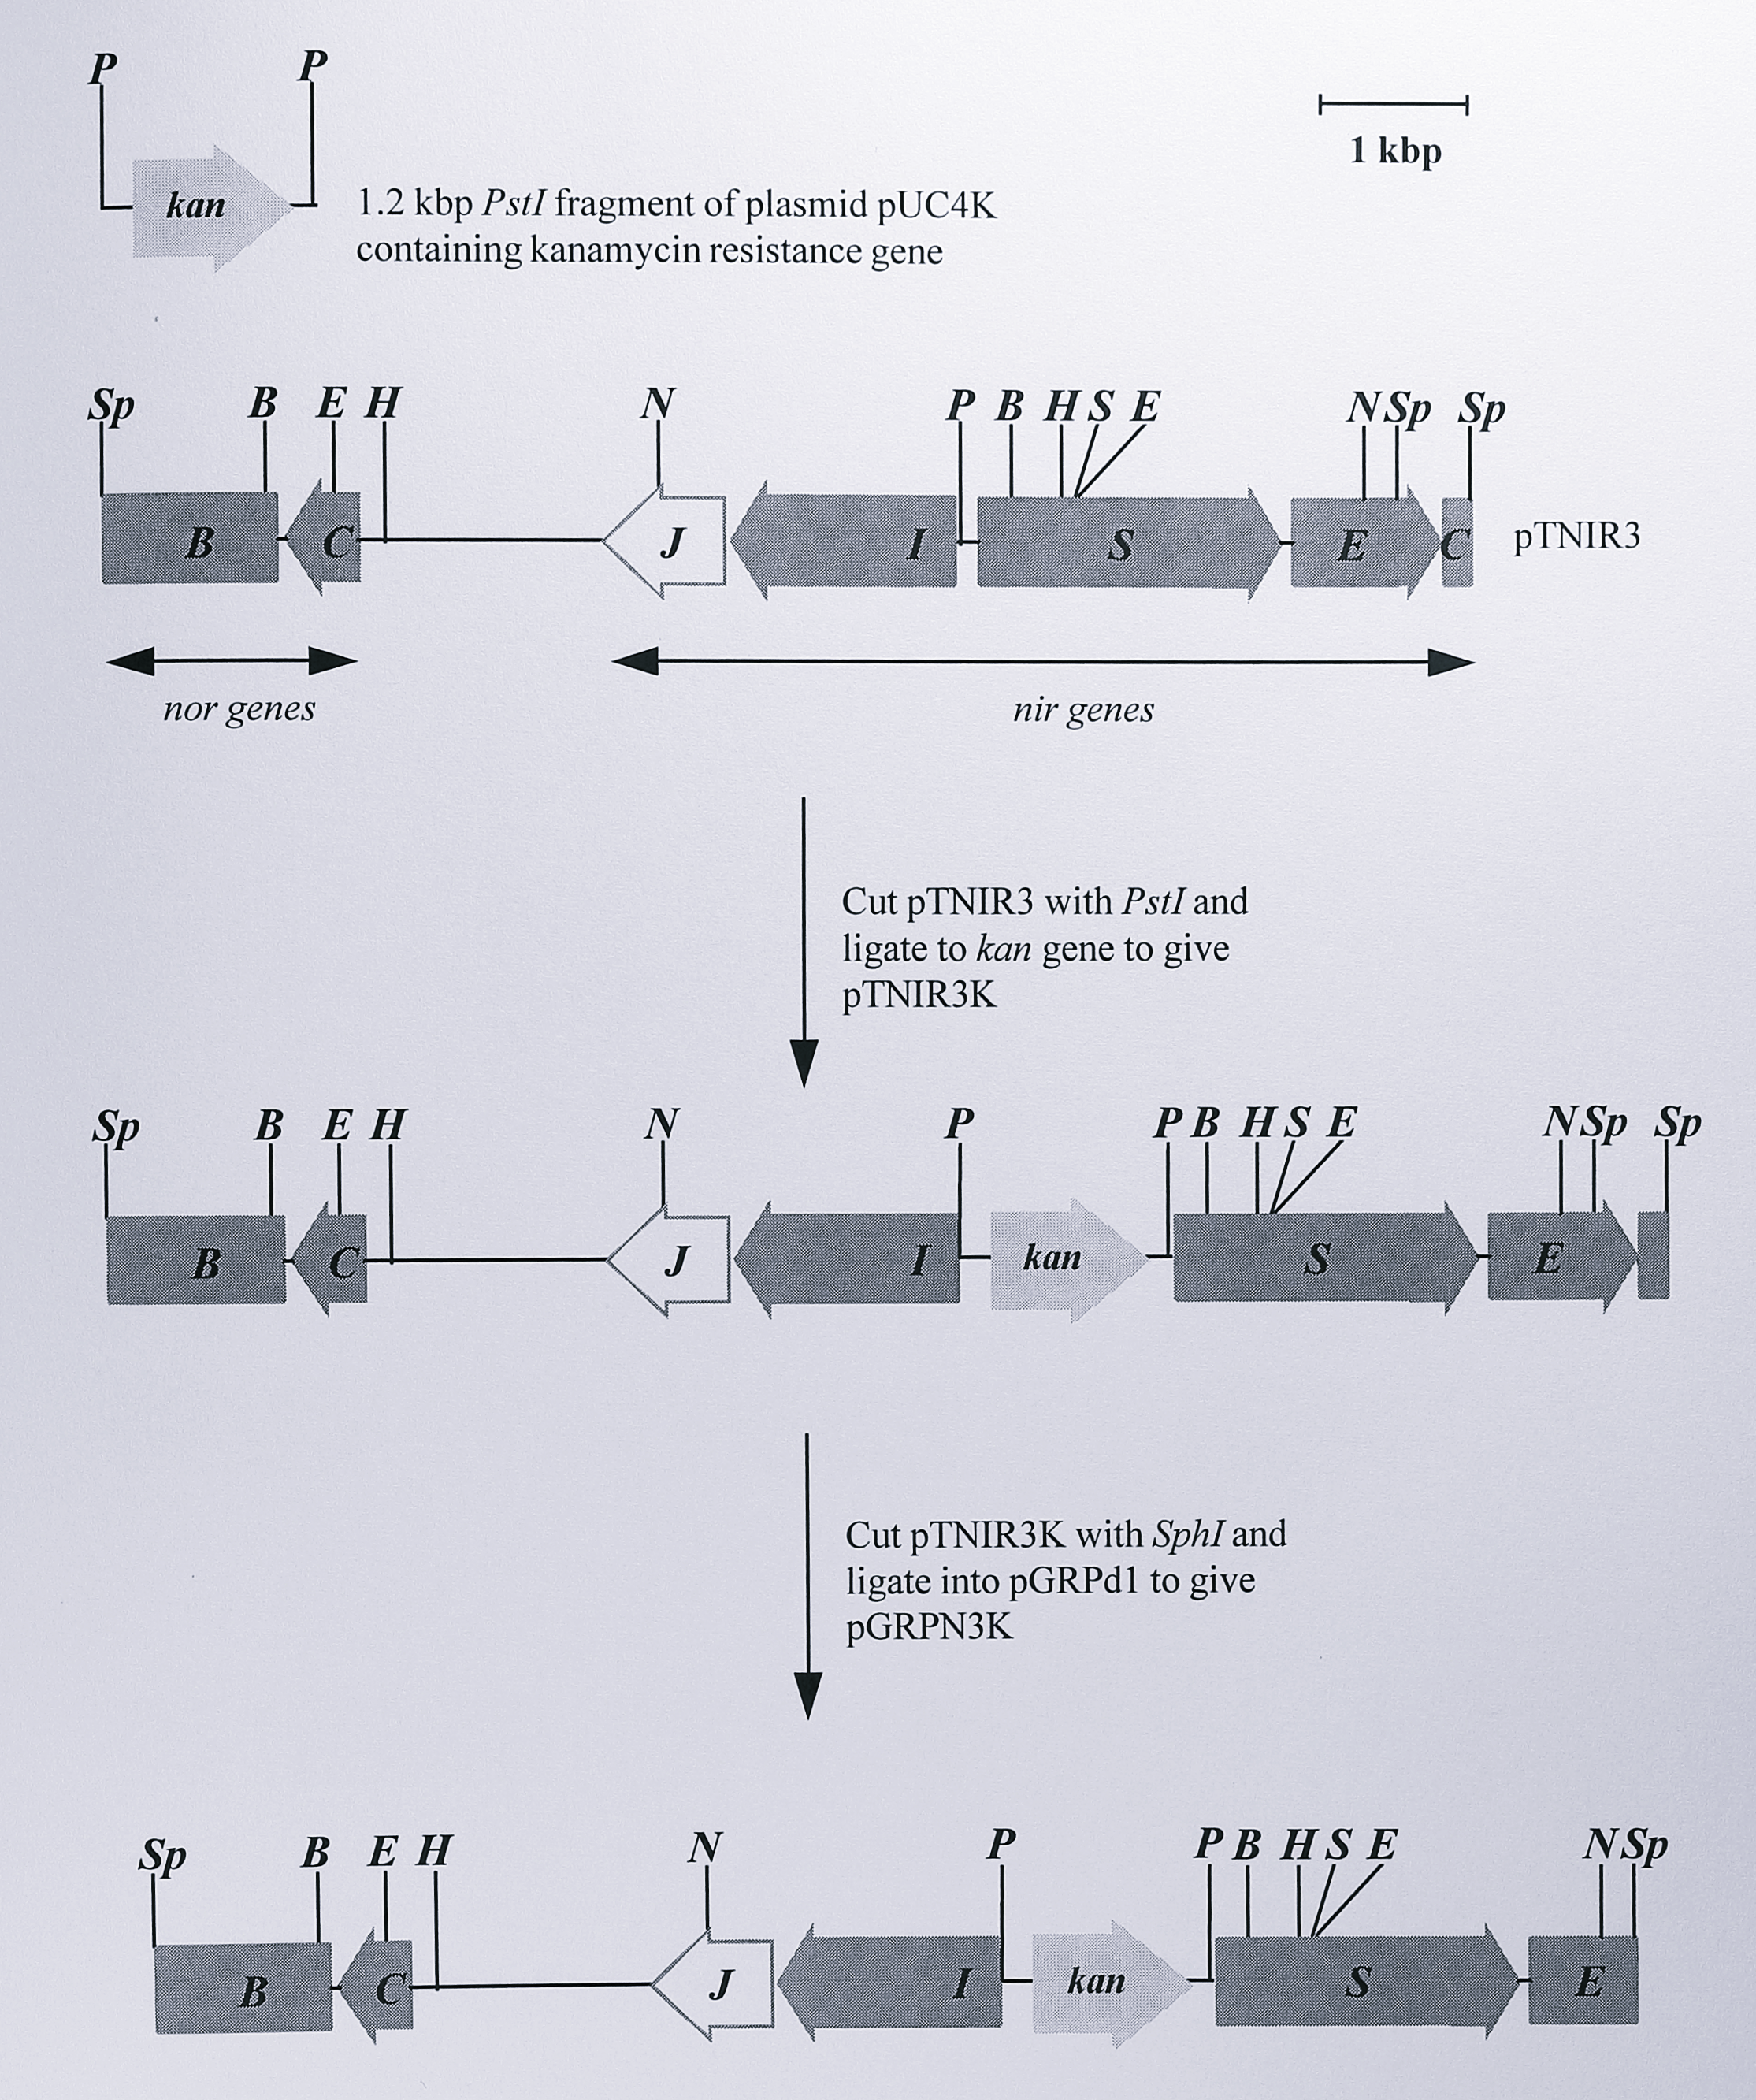
Figure 6.3: Construction of the suicide plasmid pGRPN3K. Full details of plasmids are given in Table 6.1. Only the relevant restriction fragments are shown. Plasmid pGRPN3K was used to construct the kanamycin insertion mutant T. pantotropha K7. Enzymes: B, BamHI, E, EcoRI, H, HindIII, N, NotI, P, PstI, S, SalI, Sp, SphI.
To create this plasmid, a 1.2 kbp PstI fragment containing the kanamycin resistance gene (kan) from the plasmid pUC4K [315] was isolated and ligated into the PstI site of the plasmid pTNIR3. The latter site was located 27 bp upstream of the nirS NNR box. The new plasmid, designated pTNIR3K, was digested with SphI to generate an 8.3 kbp fragment containing the kan gene and having 5’- and 3’-ends in the norB and nirE genes respectively, as was described in Chapter 4 (Figure 4.2). The SphI fragment was ligated into the SphI site of the suicide plasmid pGRPd1, to give the final construct for use in insertional mutagenesis which was designated pGRPN3K. The plasmid was analysed by restriction digestion to confirm that it was the desired construct (Figure 6.4).
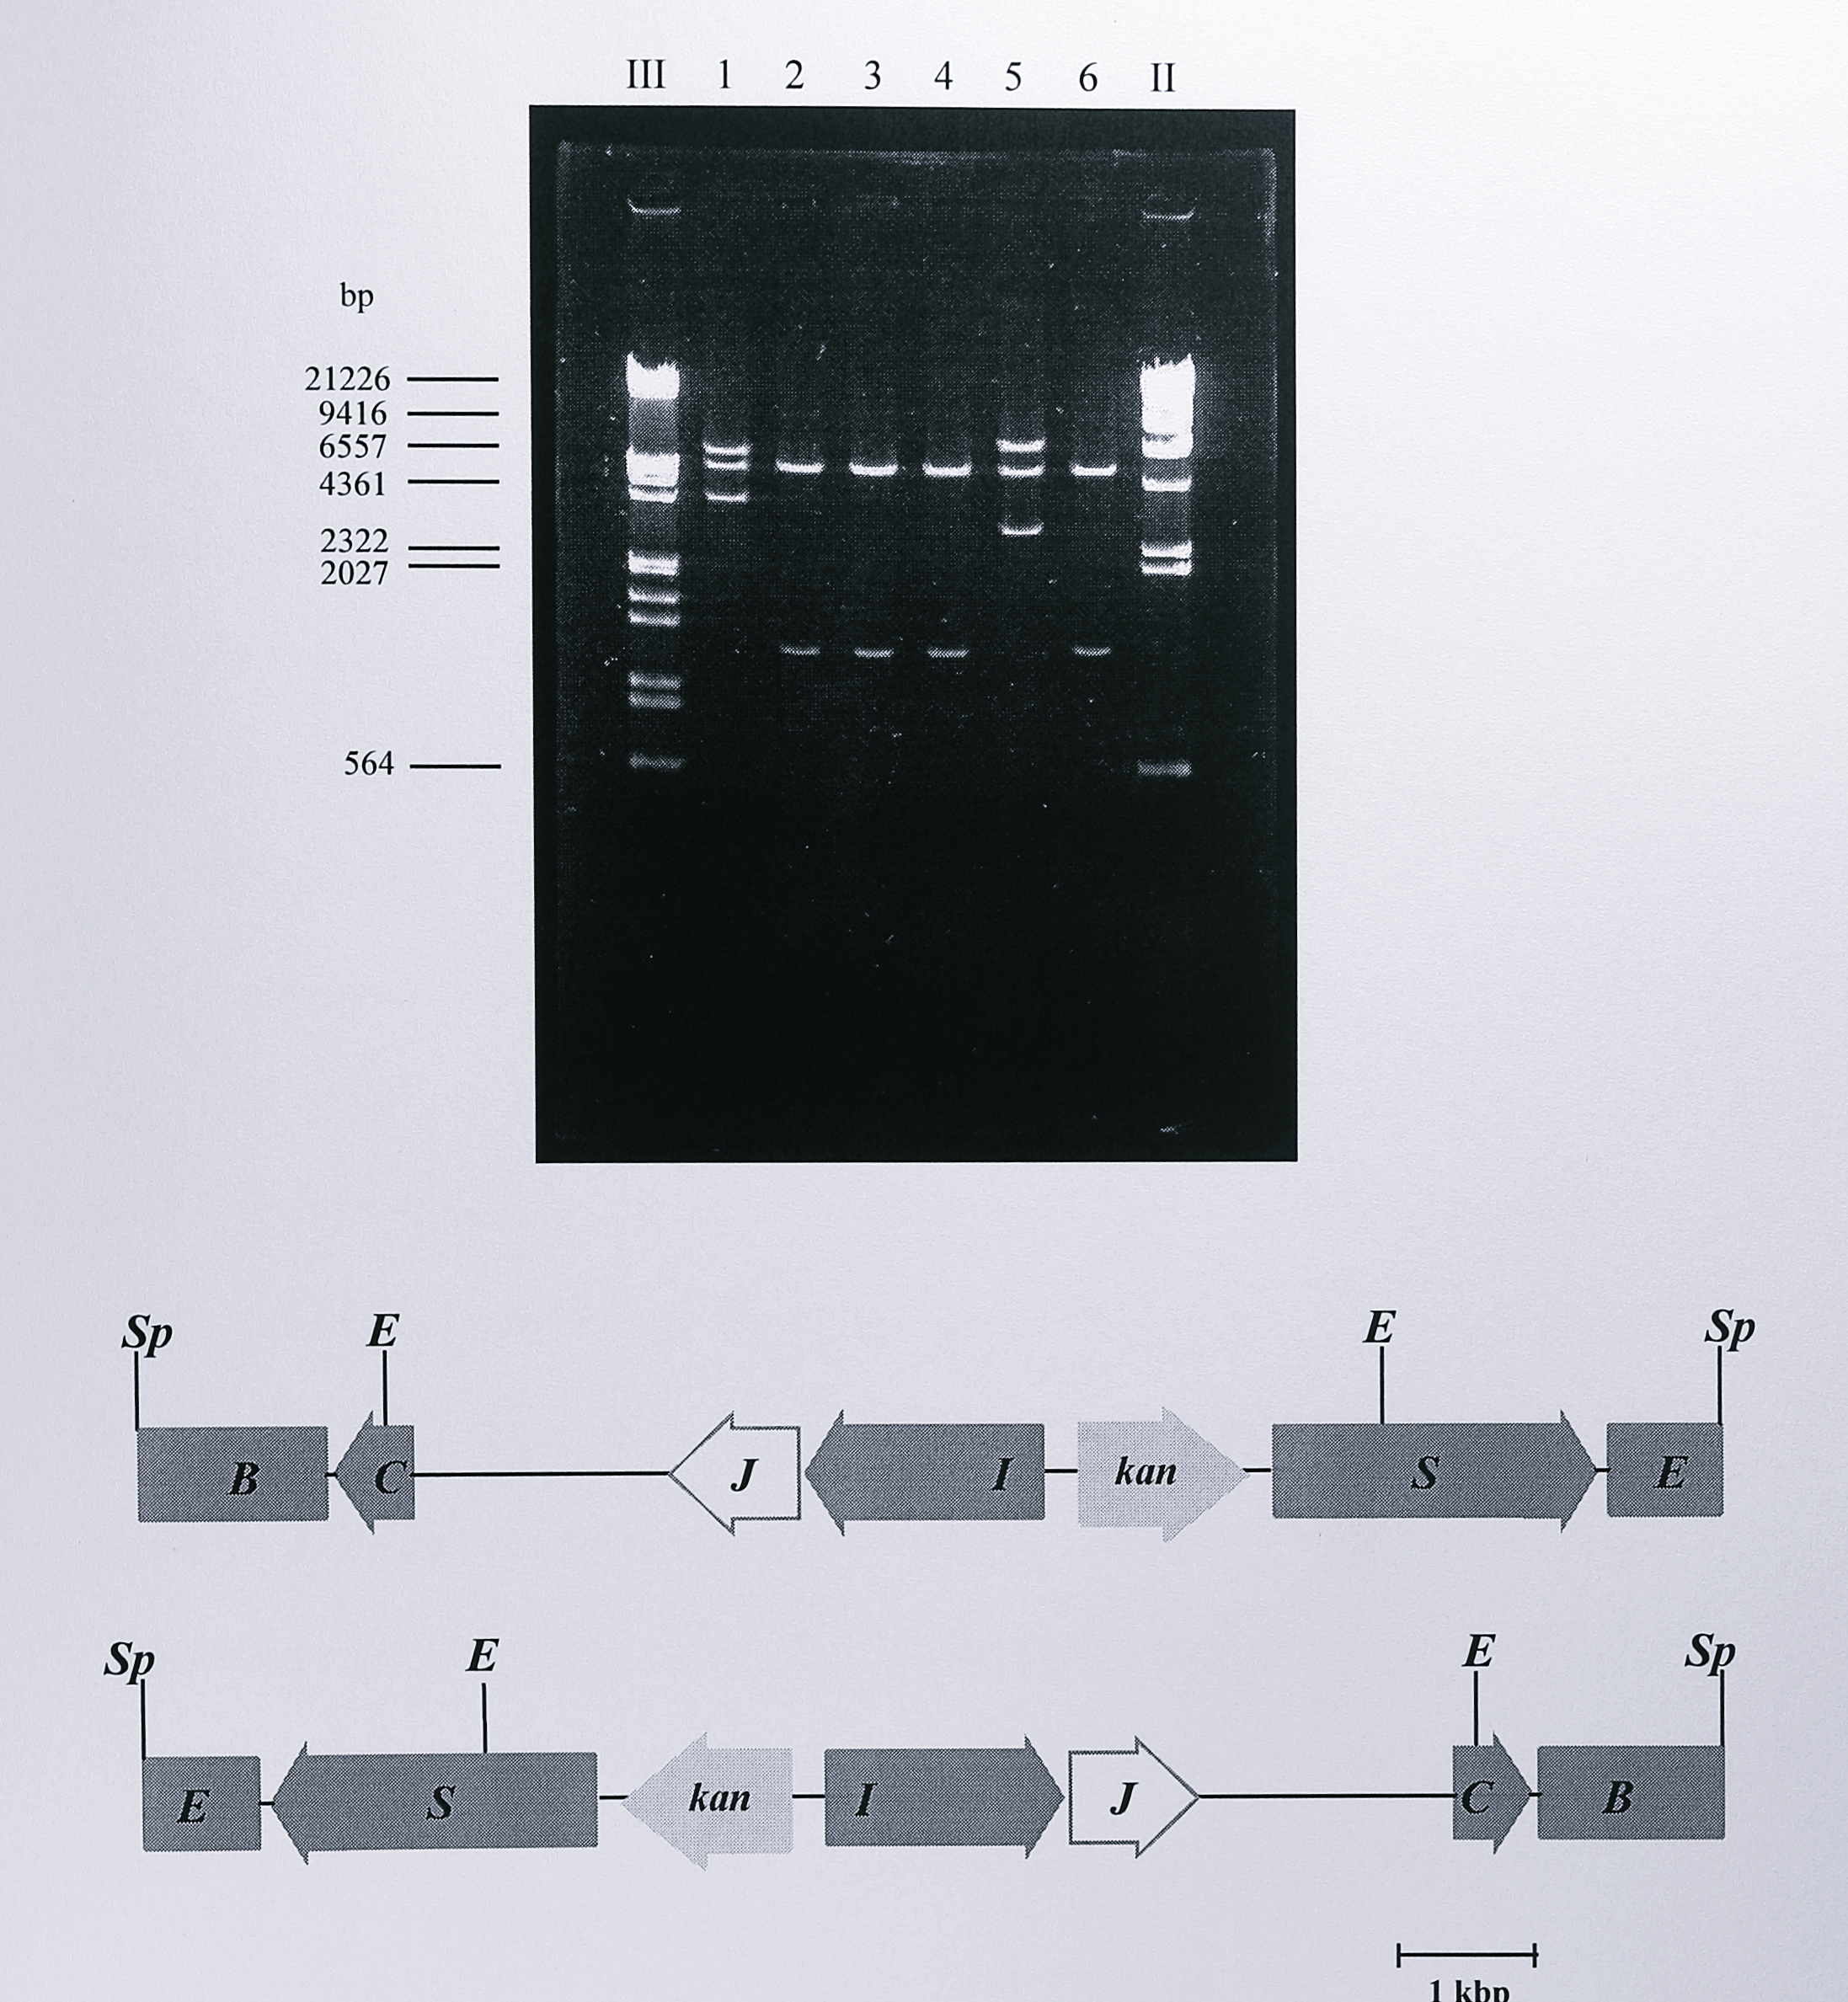
Figure 6.4: Restriction digest analysis of plasmid pGRPN3K. Following ligation and transformation, plasmid DNA was isolated from the transformed cells and digested using EcoRI (lanes 1-6), the DNA fragments were separated by electrophoresis on a 0.8% agarose gel. The possible orientations of the SphI insert from pTNIR3K are shown below the gel. Two EcoRI sites in the insert and a third site in the vector produce three fragments of approximate sizes 6.3, 5.6 and 3.6 kbp (first orientation) or 7.0, 5.6 and 2.9 Kbp (second orientation). These are seen in lanes 1 and 5 respectively. Enzymes: E, EcoRI, Sp, SphI. Lanes labelled III and II contain DNA size standards, the sizes of some of which are indicated to the left of the gel.
T. pantotropha was transformed with pGRPN3K by conjugal transfer of the plasmid from E. coli S17-1. The mated cells were harvested, serially diluted and plated on minimal acetate medium containing 100 \(\mu\)g ml\(^{-1}\) kanamycin and 1 mM PbNO\(_3\) to select for T. pantotropha that had taken up the plasmid. 50 transconjugant colonies were picked from these plates and streaked onto fresh minimal acetate medium containing 100 \(\mu\)g ml\(^{-1}\) kanamycin and onto identical plates that contained additionally 100 \(\mu\)g ml\(^{-1}\) spectinomycin. The selection step distinguished vector integrant strains arising from a single crossover (phenotype Km\(^r\)Sp\(^r\)) from the desired insertion mutant strains which arose from a double crossover (phenotype Km\(^r\)Sp\(^s\)). Fifteen of the latter type were identified, although each streak was still contaminated to some degree with E. coli S17-1. To remove the contaminants one of the streaks was picked with a sterile loop, diluted in LB medium and lated on LB medium containing 100 \(\mu\)g ml\(^{-1}\) kanamycin and 1 mM PbNO\(_3\). Four single colonies were obtained from this plate and designated T. pantotropha K7-K10. The colonies were confirmed as having the required Km\(^r\)Sp\(^s\) phenotype. To confirm correct insertion of the kanamycin resistance marker into the chromosome, genomic DNA was isolated from T. pantotropha K7, digested with HindIII and probed by Southern blotting using the 1.2 kbp fragment of pUC4K labelled with digoxigenin. Fragments of the expected sizes (4.8 and 1.1 kbp) were observed on the blot (Figure 6.5), confirming that the kan gene had inserted only once in the expected site.
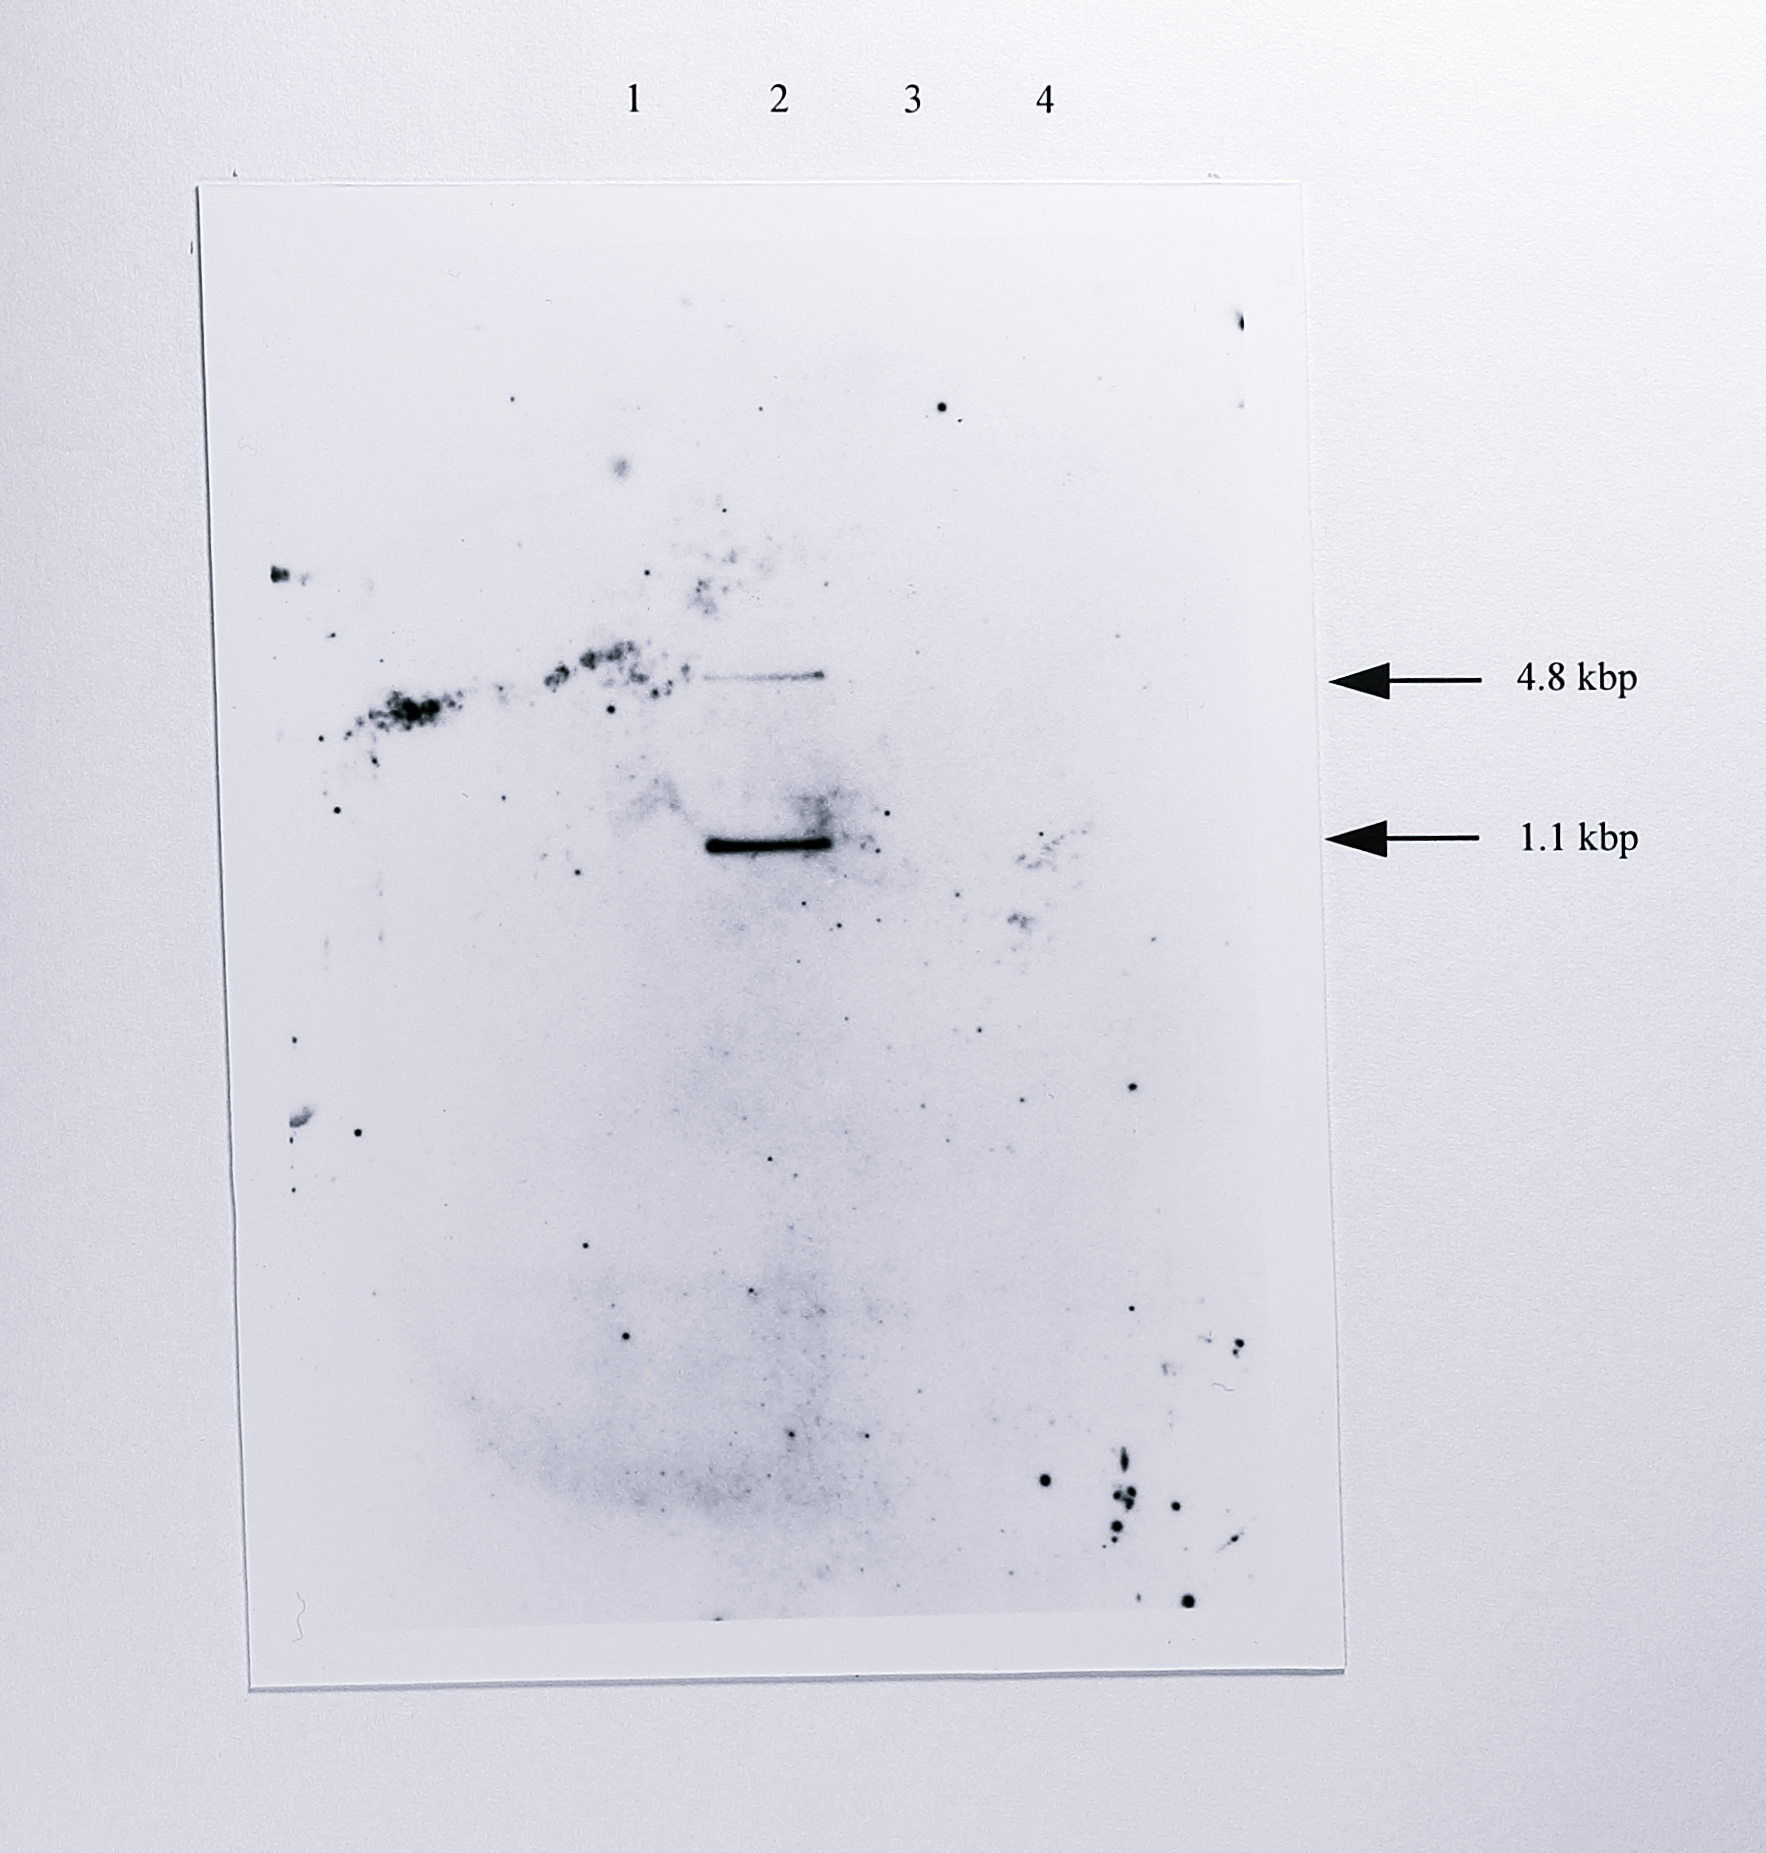
Figure 6.5: Southern blot of genomic DNA from T. pantotropha K7 using the kanamycin resistance gene as a probe. Genomic DNA from wild-type T. pantotropha, T. pantotropha K7 and T. pantotropha \(\Delta7\) was digested using HindIII and probed with the 1.2 kbp PstI fragment of pUC4K, labelled with digoxigenin-alkaline phosphatase conjugate. The two fragments of molecular weights 4.8 and 1.1 kbp in lane 2 arise from the insertion of the kan gene upstream of the nirS gene (Figure 6.3). Lanes: 1, T. pantotropha wild-type, 2, T. pantotropha K7,3, T. pantotropha \(\Delta7\), 4, T. pantotropha \(\Delta8\).
Construction of the suicide plasmid containing a deletion in the nirS gene is outlined in Figure 6.6.
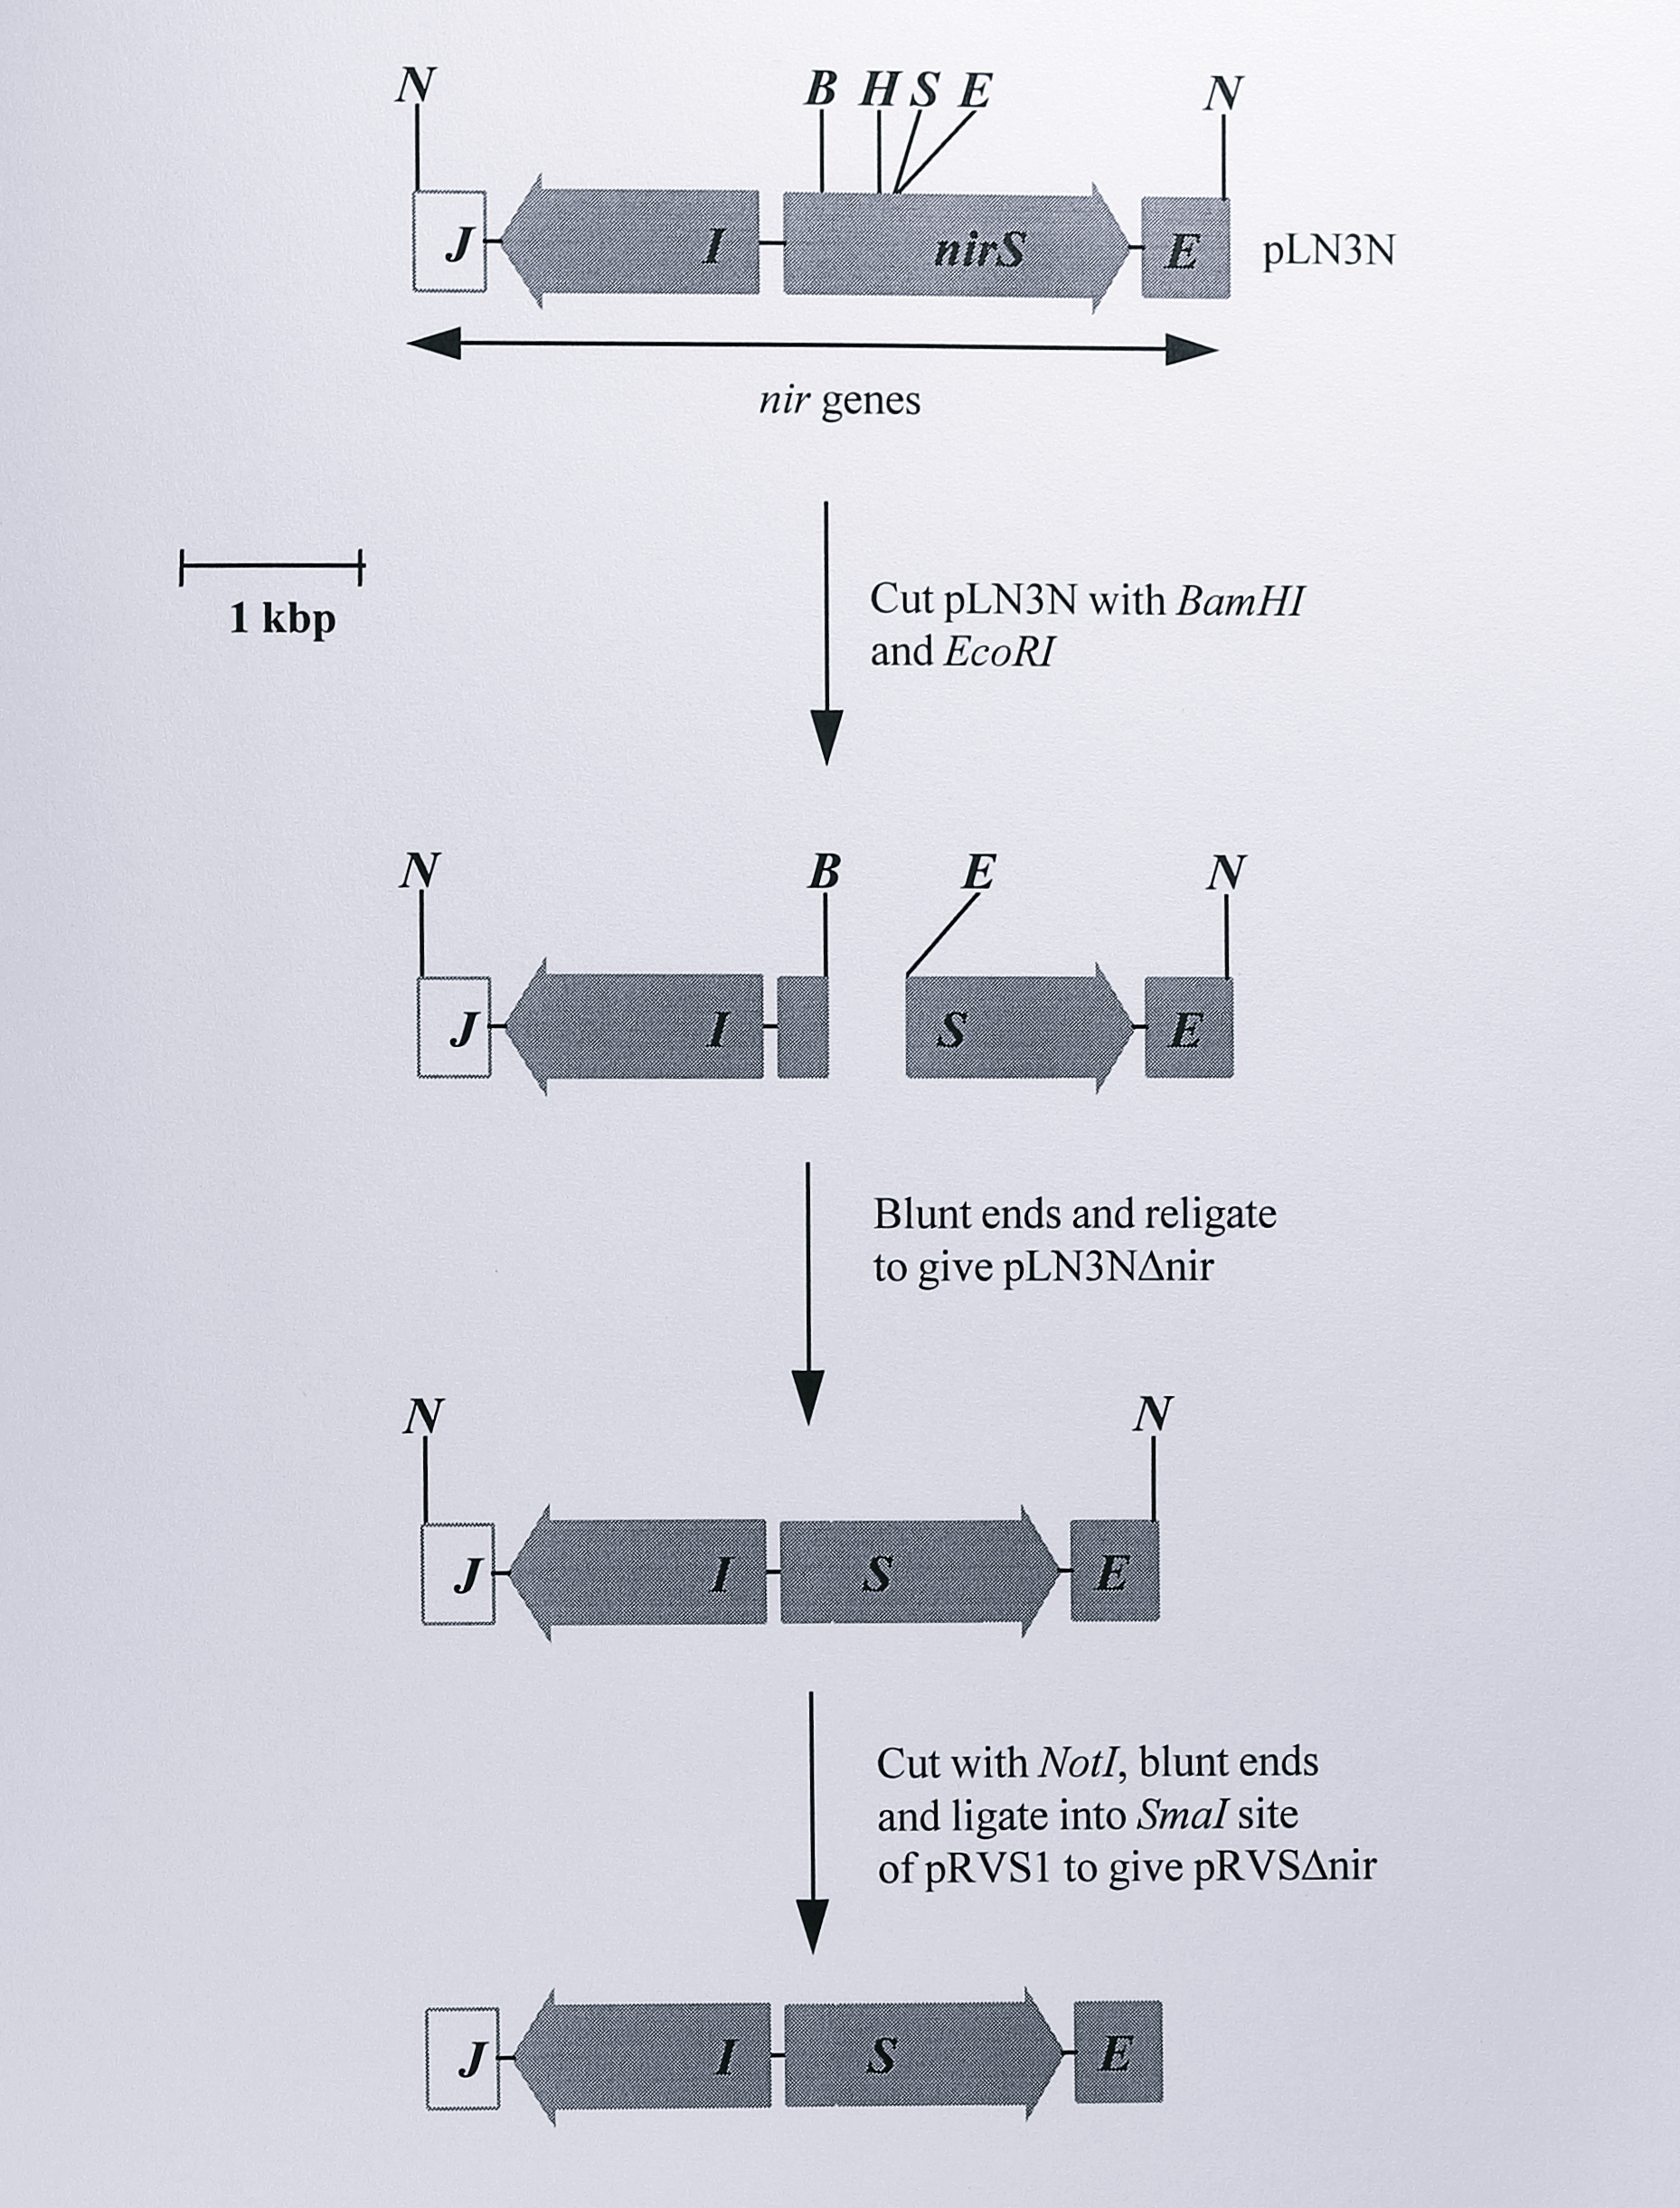
Figure 6.6: Construction of the suicide plasmid pRVS\(\Delta\)nir. Only the relevant restriction fragments are shown. Full details of the plasmids are given in Table 6.1. Plasmid pRVS\(\Delta\)nir was used to construct the nirS deletion mutants \(\Delta5\), \(\Delta7\), \(\Delta8\). Enzymes: B, BamHI, E, EcoRI, H, HindIII, N, NotI, S, SalI.
A 4.2 kbp NotI fragment containing the nirS gene and approximately 1.9 kbp and 0.5 kbp of upstream and downstream DNA respectively was isolated from the plasmid pTNIR3 and ligated into the NotI site of the plasmid pGEM5zf(+), giving a plasmid which was designated pLN3N. pLN3N was digested using BamHI and EcoRI to remove an internal fragment of 382 bp from the nirS gene. The fragment corresponded to amino acids 9 to 136 in the mature cytochrome cd\(_1\) polypeptide and included the haem ligands His-17 and Tyr-25. The DNA fragment from which the 382 bp fragment had been removed was isolated, the ends were blunted using T4 DNA polymerase and the plasmid was religated. The absence of the 382 bp fragment was demonstrated with digests using the enzymes PstI, NotI and SalI (Figure 6.7).
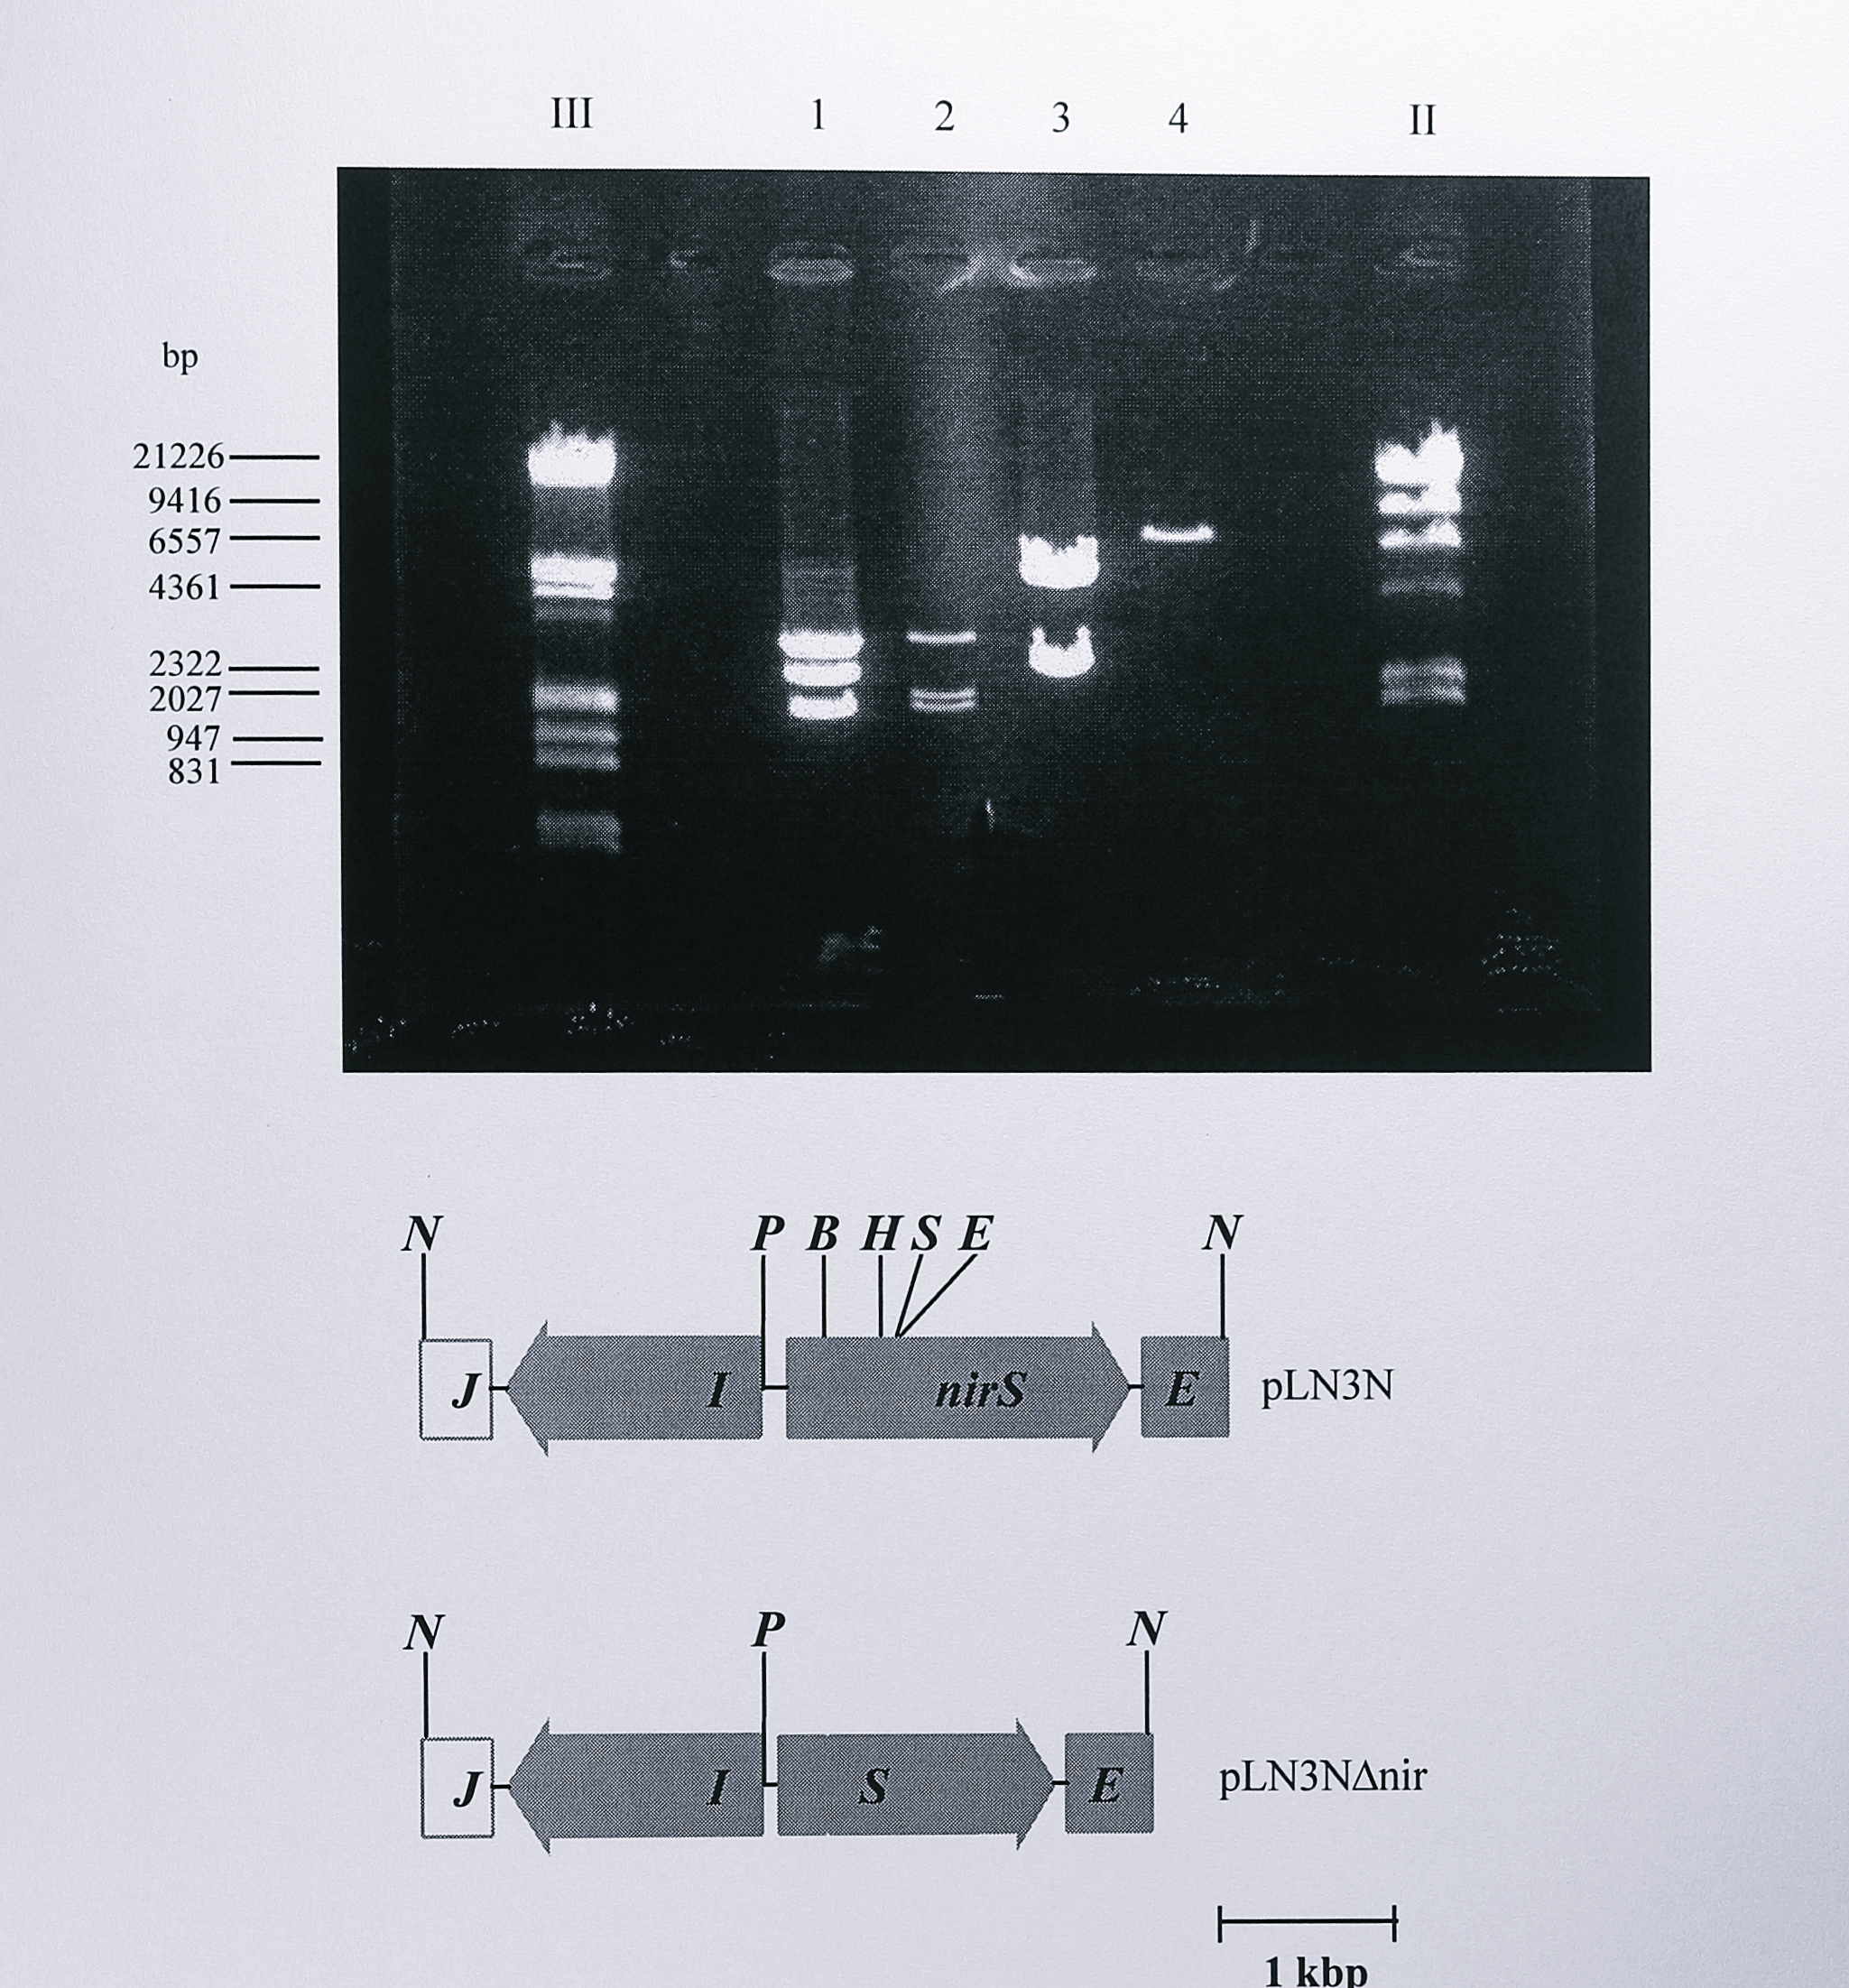
Figure 6.7: Restriction digest analysis of plasmids pLN3N and pLN3N\(\Delta\)nir. Following ligation and transformation, plasmid DNA was isolated from the transformed cells and digested using PstI plus NotI (lanes 1 and 2) or SalI (lanes 3 and 4). The digested DNA was separated by electrophoresis on a 0.8% agarose gel. Lanes 1 and 3 contain DNA from pLN3N, lanes 2 and 4 contain DNA from pLN3N\(\Delta\)nir. In lane 1, three fragments of approximate sizes 3, 2.4 and 1.8 kbp are seen. The two smaller fragments correspond to the NotI insert from pLN3N. In lane 2 the 2.4 kbp fragment has moved to 2 kbp, due to the removal of the 382 bp BamHI - EcoRI fragment. Lane 3 shows two SalI fragments from pLN3N. In lane 4 the internal SalI site in the 382 bp BamHI - EcoRI fragment has been lost, giving a linearised plasmid of approximate size 6.9 kbp. Enzymes: B, BamHI, E, EcoRI, H, HindIII, N, NotI, P, I, S, SalI. Lanes labelled III and II contain DNA size standards, some of which are indicated at the left of the gel.
These digests showed clearly that the plasmid had lost 382 bp and that a SalI site which lay between the BamHI and EcoRI sites was not present. The new plasmid with the 382 bp deletion was named pLN3N\(\Delta\)nir. The NotI fragment of pLN3N\(\Delta\)nir, now 3.8 kbp long, was isolated, the ends were blunted using Sequenase (T7 DNA polymerase) and the fragment was ligated into the SmaI site of the suicide vector pRVS1 to give the final construct for mutagenesis, designated pRVS\(\Delta\)nir. The presence of the insert was confirmed by digestion with EcoRI, StyI and SalI (Figure 6.8) and by a PCR reaction using pRVS\(\Delta\)nir as template DNA and the primers nirSF and MIDR (Table 3.1, Chapter 3).
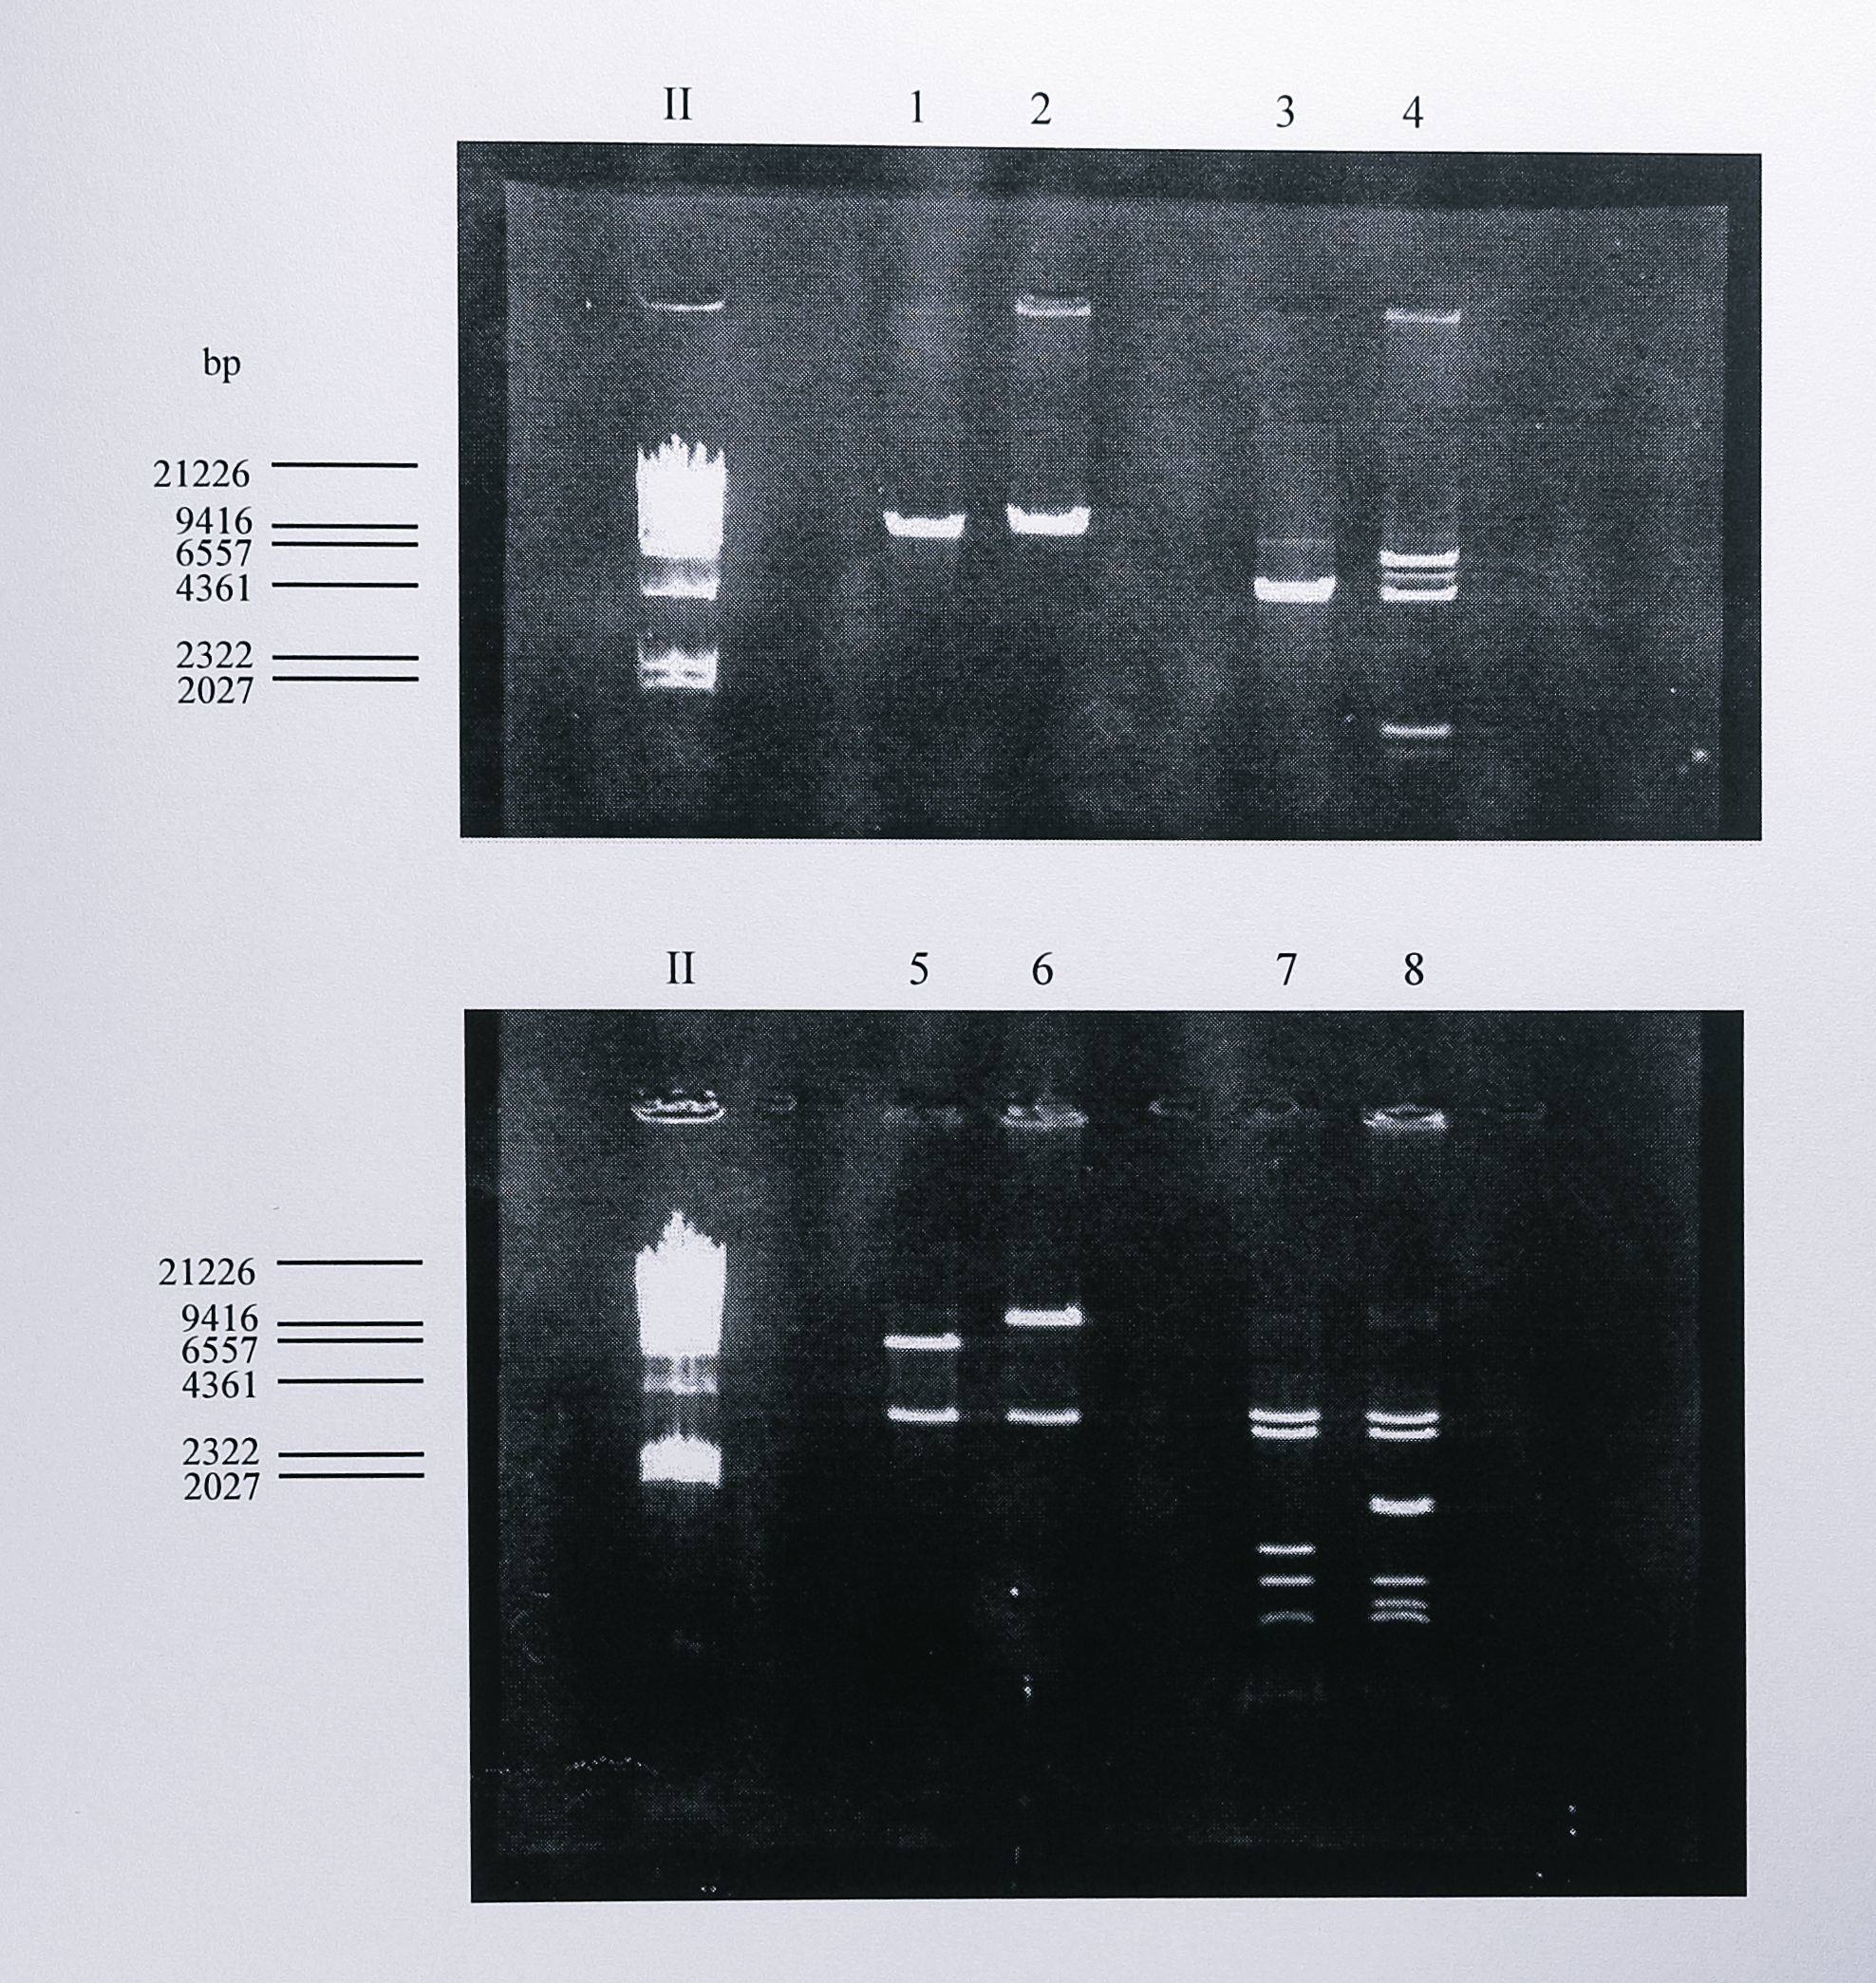
Figure 6.8: Restriction digest analysis of plasmids pRVS1 and pRVS\(\Delta\)nir. Following ligation and transformation, plasmid DNA was isolated from transformed E. coli and digested using EcoRI (lanes 1 and 2), NruI (lanes 3 and 4), SalI (lanes 5 and 6) and StyI (lanes 7 and 8). The digested DNA was then separated by electrophoresis on a 0.8% agarose gel. Lanes 1, 3, 5 and 7 contain DNA from plasmid pRVS1, lanes 2, 4, 6 and 8 contain DNA from plasmid pRVS\(\Delta\)nir. As described in the text, restriction analysis of these plasmids was difficult to interpret due to the lack of a restriction map for pRVS1. However, the digests in lanes 1-2 and 5-6 clearly show that pRVS\(\Delta\)nir contains an insert of around 3.8 kbp, the expected size of the insert. The digests in lanes 3-4 and 7-8 show extra NruI and StyI sites in pRVS\(\Delta\)nir which can be related to the known sequence of the nirS gene and to restriction analysis of plasmids containing the nir region (Chapter 4). The lane labelled II contains DNA size standards, the sizes of some of which are indicated at the left of the gel.
This primer pair gave a 903 bp PCR product from the complete nirS gene, but as the 382 bp deletion lies between the primers the expected size of the PCR fragment should have been shortened to 521 bp. The smaller product was clearly seen using pRVS\(\Delta\)nir as the template DNA (Figure 6.9).
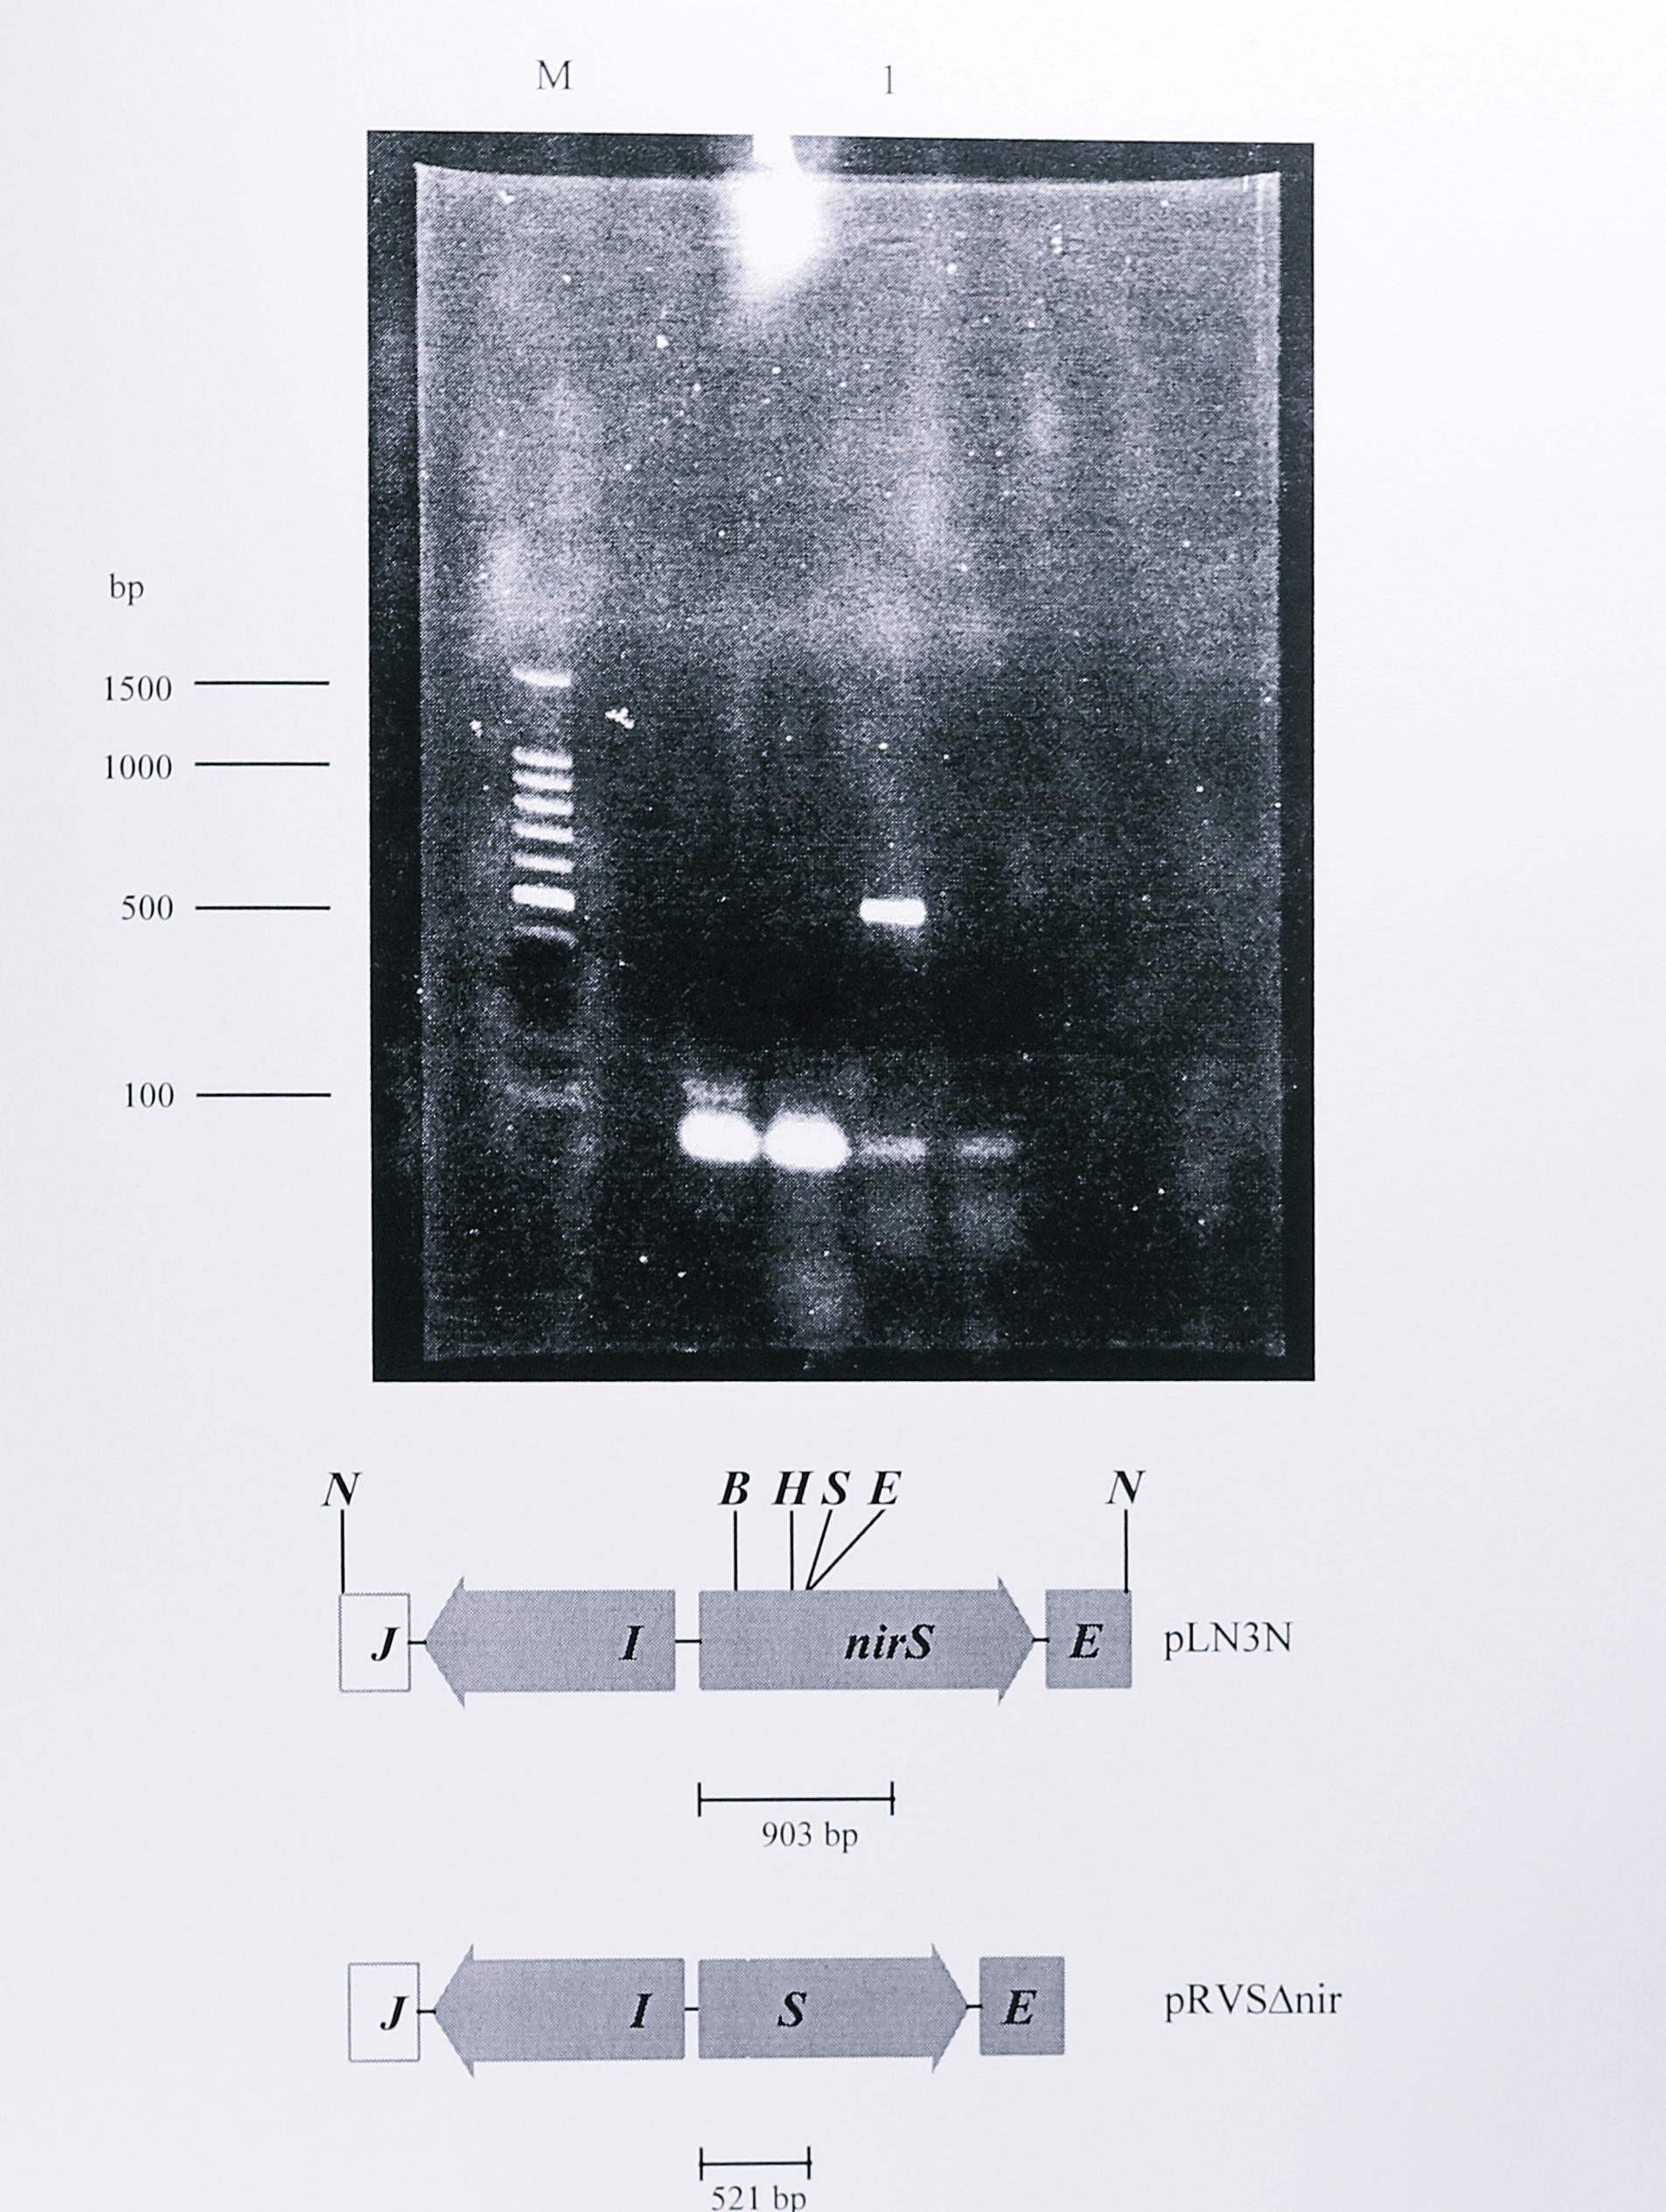
Figure 6.9: PCR analysis of plasmid pRVS\(\Delta\)nir showing a 382 bp deletion in the cloned nirS gene. Plasmid pRVS\(\Delta\)nir was used as the template in a PCR reaction with the primers nirSF (forward) and MIDR (reverse) described in Chapter 3, Table 3.1. The primer pair flanks the site of the deletion in the nirS gene, generating a PCR product of 903 bp in the wild-type gene (Chapter 3, Figure 3.1). The 382 bp deletion in this region generates a PCR product of 521 bp, which can be seen in lane 1. The lane labelled M contains a 100 bp DNA size standard ladder with some of the fragment sizes indicated at the left of the gel.
T. pantotropha K7 was transformed with pRVS\(\Delta\)nir by conjugal transfer from E. coli S17-1 and transconjugants were selected initially on LB medium containing 100 \(\mu\)g ml\(^{-1}\) kanamycin, 100 \(\mu\)g ml\(^{-1}\) spectinomycin and 40 \(\mu\)g ml\(^{-1}\) X-Gal. These conditions selected for vector integrant strains formed by a single crossover, the lacZ gene on the integrated plasmid causing the colonies to be coloured pale blue. To promote the required double crossover event, in which the vector together with the kanamycin resistance gene were excised and the deletion was inserted into the chromosomal nirS gene, a single blue colony was inoculated into 1.5 ml of LB medium that contained no antibiotics and grown aerobically overnight. This culture was inoculated into fresh LB medium and grown again. The culture was then serially diluted and plated on LB medium containing X-Gal at a concentration of 80 \(\mu\)g ml\(^{-1}\). Most of the colonies obtained were vector integrants which formed small dark-blue colonies on these plates. However, 25 white colonies were obtained and these were streaked onto either LB medium, LB medium plus 100 \(\mu\)g ml\(^{-1}\) kanamycin or LB medium plus 100 \(\mu\)g ml\(^{-1}\) spectinomycin. Of these, three exhibited the required white, Km\(^s\)Sp\(^s\) phenotype; they were stocked and designated T. pantotropha \(\Delta5\), \(\Delta7\) and \(\Delta8\). To confirm that the deletion in the chromosomal nirS gene was correct, genomic DNA was prepared from wild-type T. pantotropha, T. pantotropha K7 and the three deletion mutants, digested using StyI and probed by Southern blotting using a 141 bp fragment of the nirS gene that had been labelled with digoxigenin by PCR. The Southern blot (Figure 6.10) showed all of the expected hybridising fragments, confirming that the deletion mutants were the desired ones.
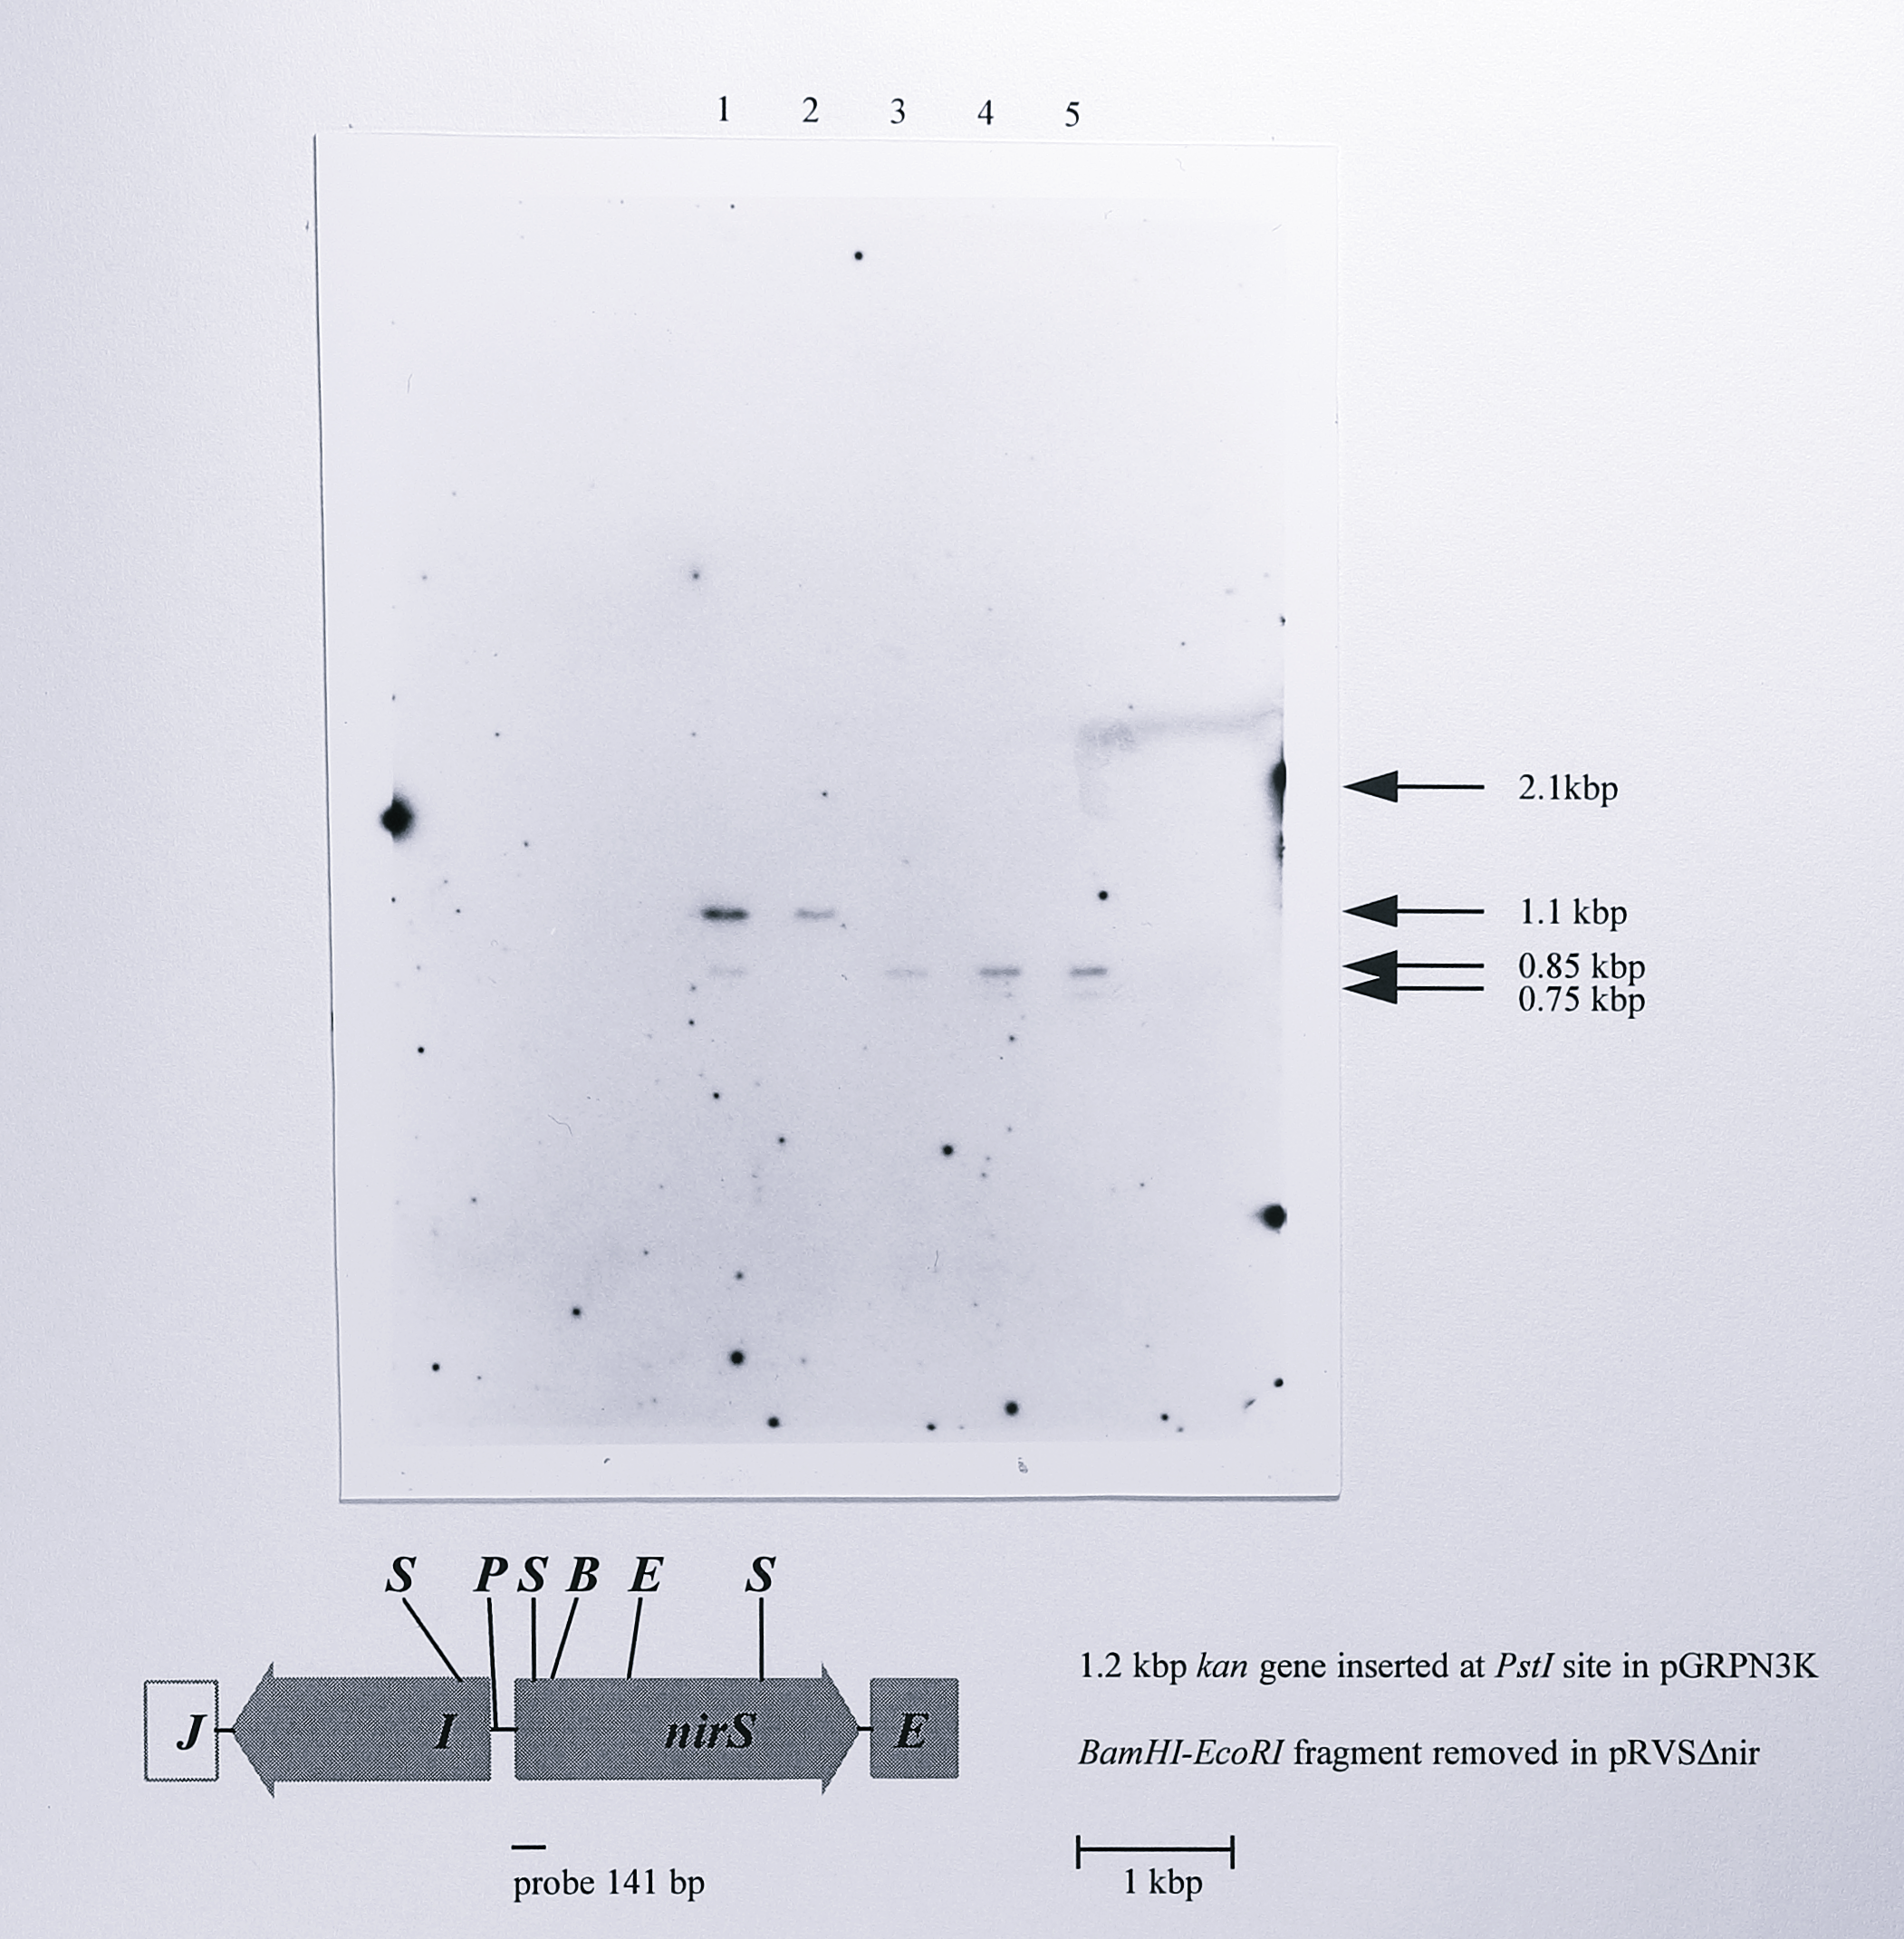
Figure 6.10: Southern blot of genomic DNA from wild-type T. pantotropha, T. pantotropha K7 and the nirS deletion mutants \(\Delta5\), \(\Delta7\) and \(\Delta8\) using a nirS-derived probe. Genomic DNA was digested using StyI and probed using a 141 bp PCR product derived from the nirS gene using the primers nirSF and 228R (Table 3.1, Chapter 3), labelled with digoxigenin-alkaline phosphatase conjugate. The map below the blot indicates the StyI sites in the 4.2 kbp NotI fragment in which the deletion was made to give pRVS\(\Delta\)nir. All of the expected fragments are visible on the blot except for the 2.1 kbp fragment in the insertion mutant strain; the larger size of this fragment and the small degree of overlap of the probe resulted in a very weak hybridisation that was barely visible on the original blot and cannot be seen on the photograph. The position of the 2.1 kbp fragment is indicated at the right of the gel, along with the other fragments. Lanes: 1, T. pantotropha wild-type, 2, T. pantotropha K7, 3-5, T. pantotropha \(\Delta5\), \(\Delta7\) and \(\Delta8\). Enzymes: S, StyI, P, PstI, B, BamHI, E, EcoRI
6.2.2 Analysis of the nirS insertion and deletion mutants
The kanamycin insertion mutant, unmarked deletion mutant and wild-type strains of T. pantotropha were compared first by growing each strain anaerobically in minimal succinate medium plus 20 mM KNO\(_3\) (Figure 6.11).
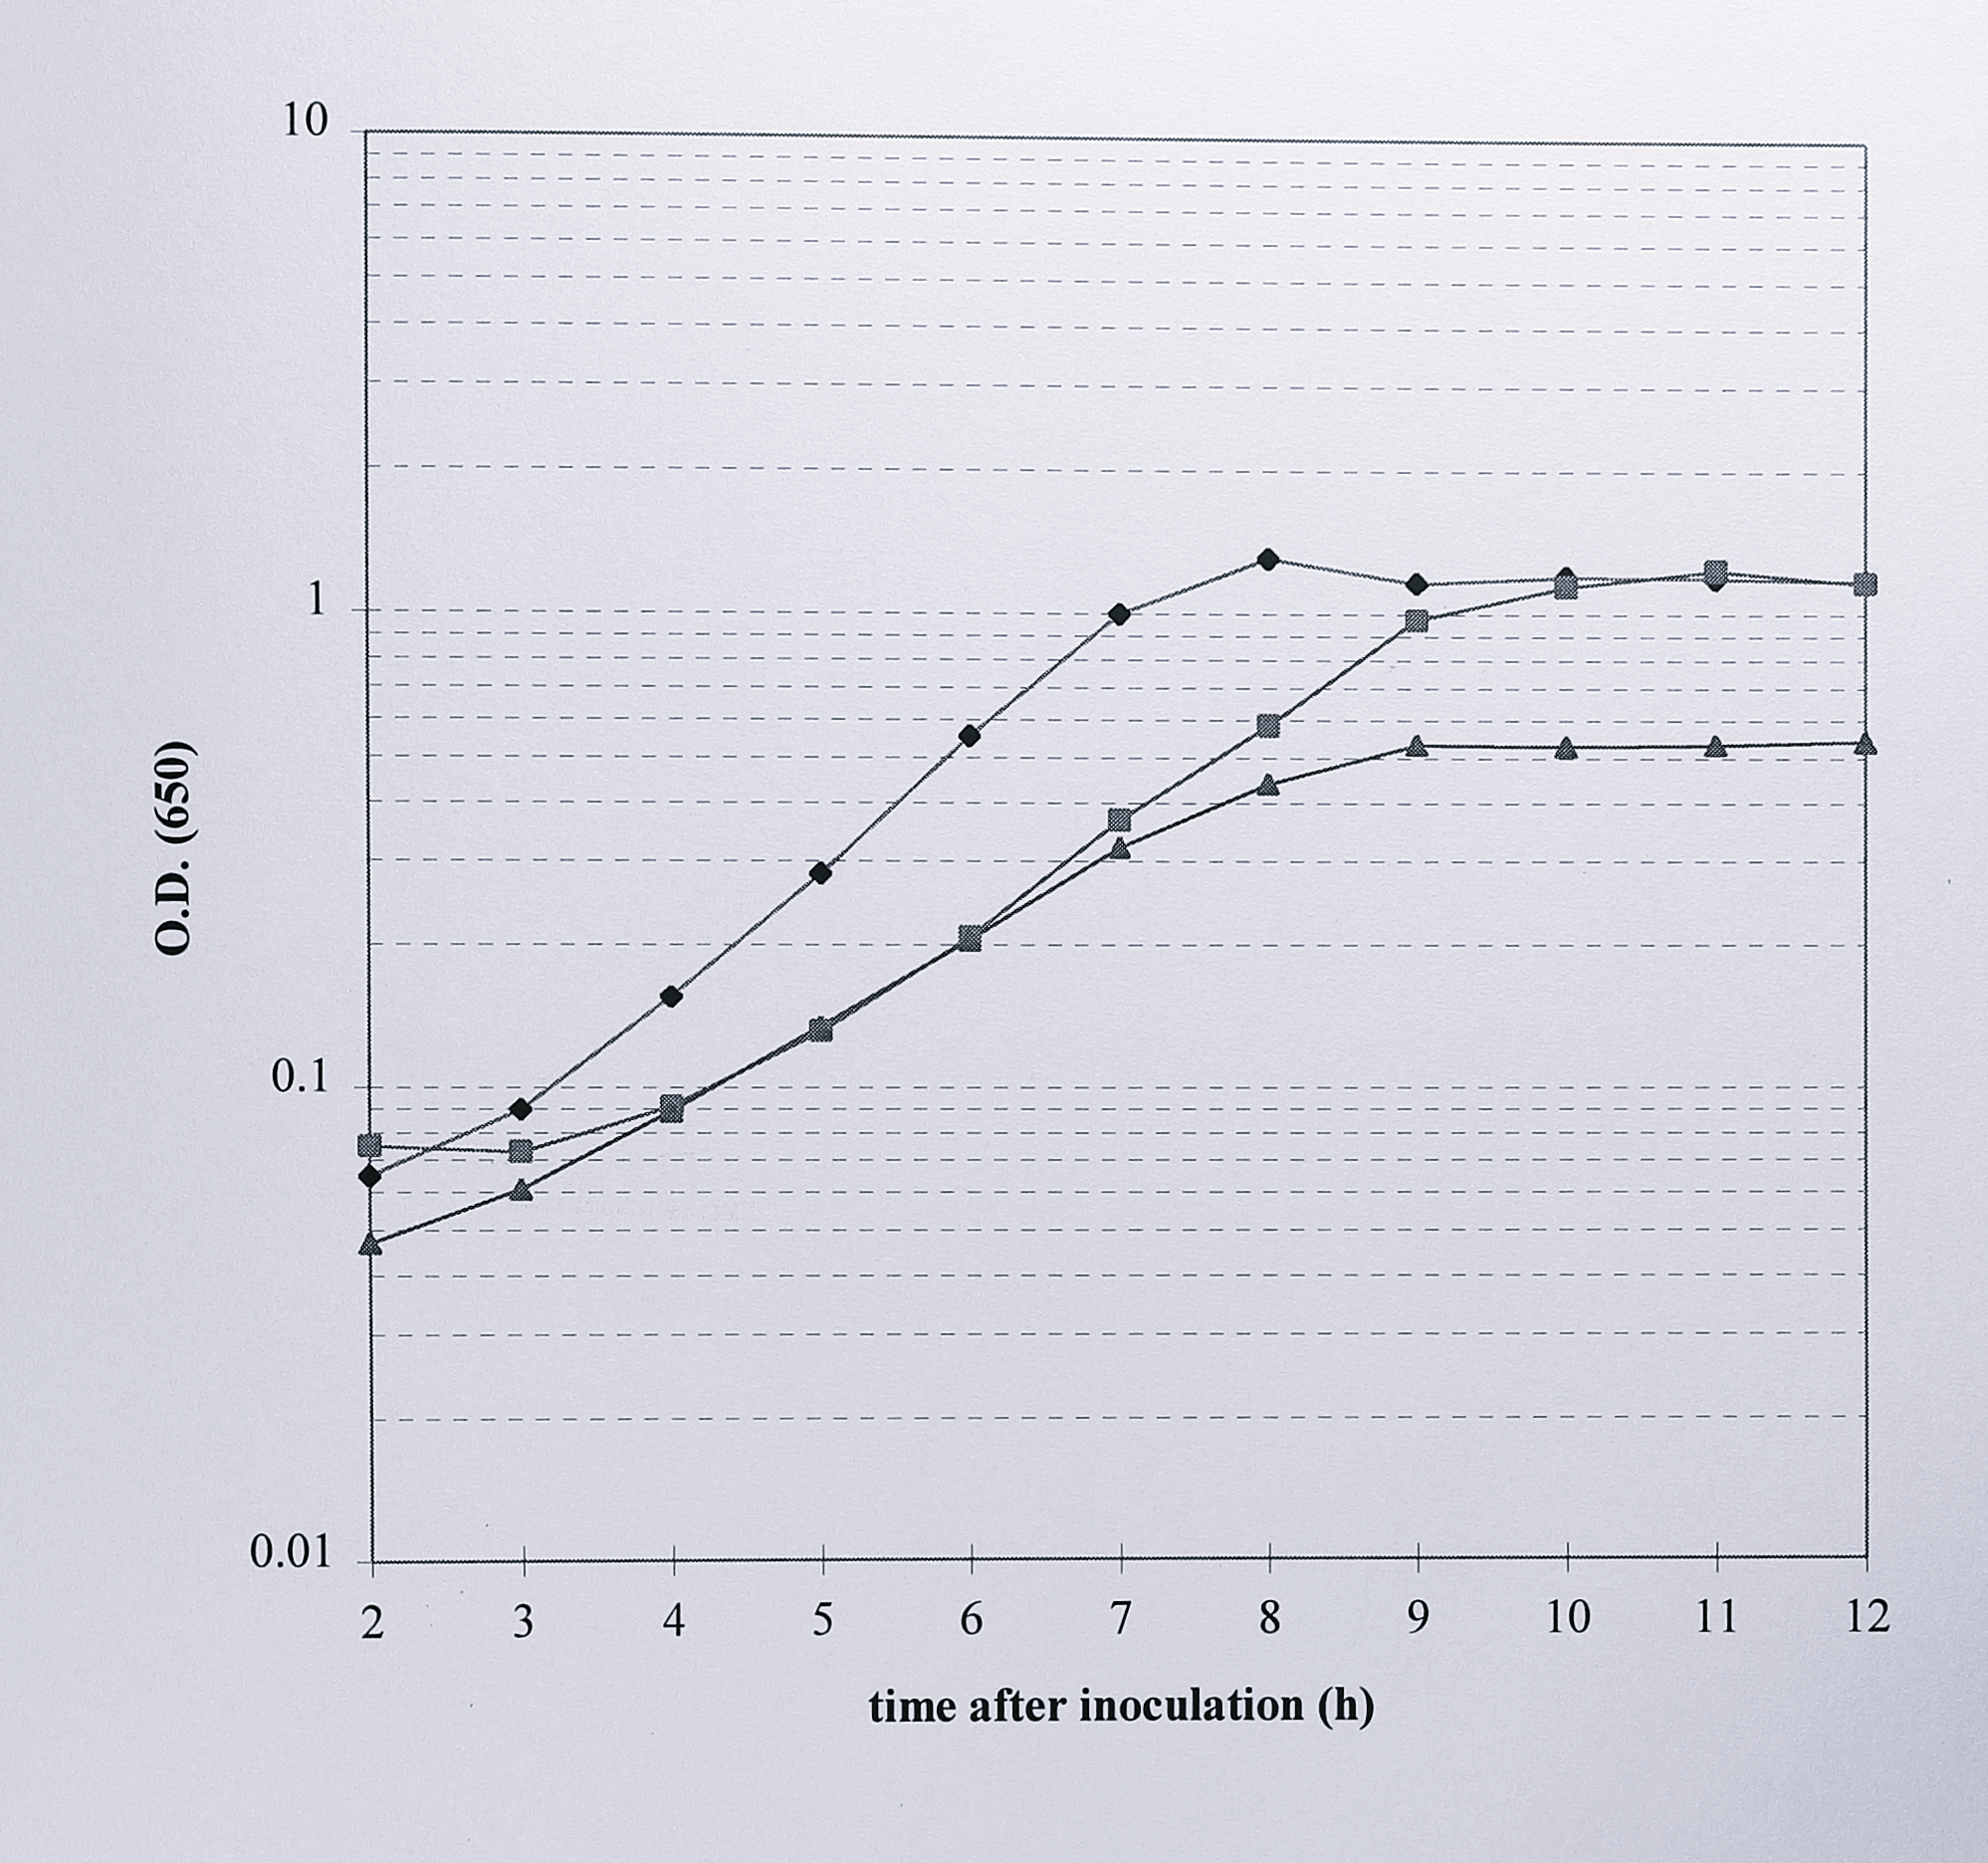
Figure 6.11: Comparison of the anaerobic growth of T. pantotropha with that of T. pantotropha K7 and T. pantotropha \(\Delta7\). Overnight cultures of each strain were inoculated at a dilution of 1/100 into minimal succinate medium plus 20 mM nitrate and growth was monitored by the increased absorbance at 650 nm (logarithmic scale). Symbols: (◆) T. pantotropha, (■) T. pantotropha K7, (▲) T. pantotropha \(\Delta7\). The other deletion mutant strains (\(\Delta5\) and \(\Delta8\)) grew identically to \(\Delta7\).
T. pantotropha wild-type and strain K7 grew at similar rates and reached a similar final optical density of around 1.3 at 650 nm. However, the three nirS deletion mutants grew poorly; each one entered stationary phase earlier than the wild-type or kanamycin insertion strains and reached a final A\(_{650}\) of only around 0.52. In the unmarked deletion mutants cytochrome cd\(_1\) should be absent, leading to a build up of toxic nitrite due to nitrate reductase activity. To confirm this, 1 ml samples were taken from each of the three cultures, harvested and assayed colorimetrically for nitrite (Figure 6.12).
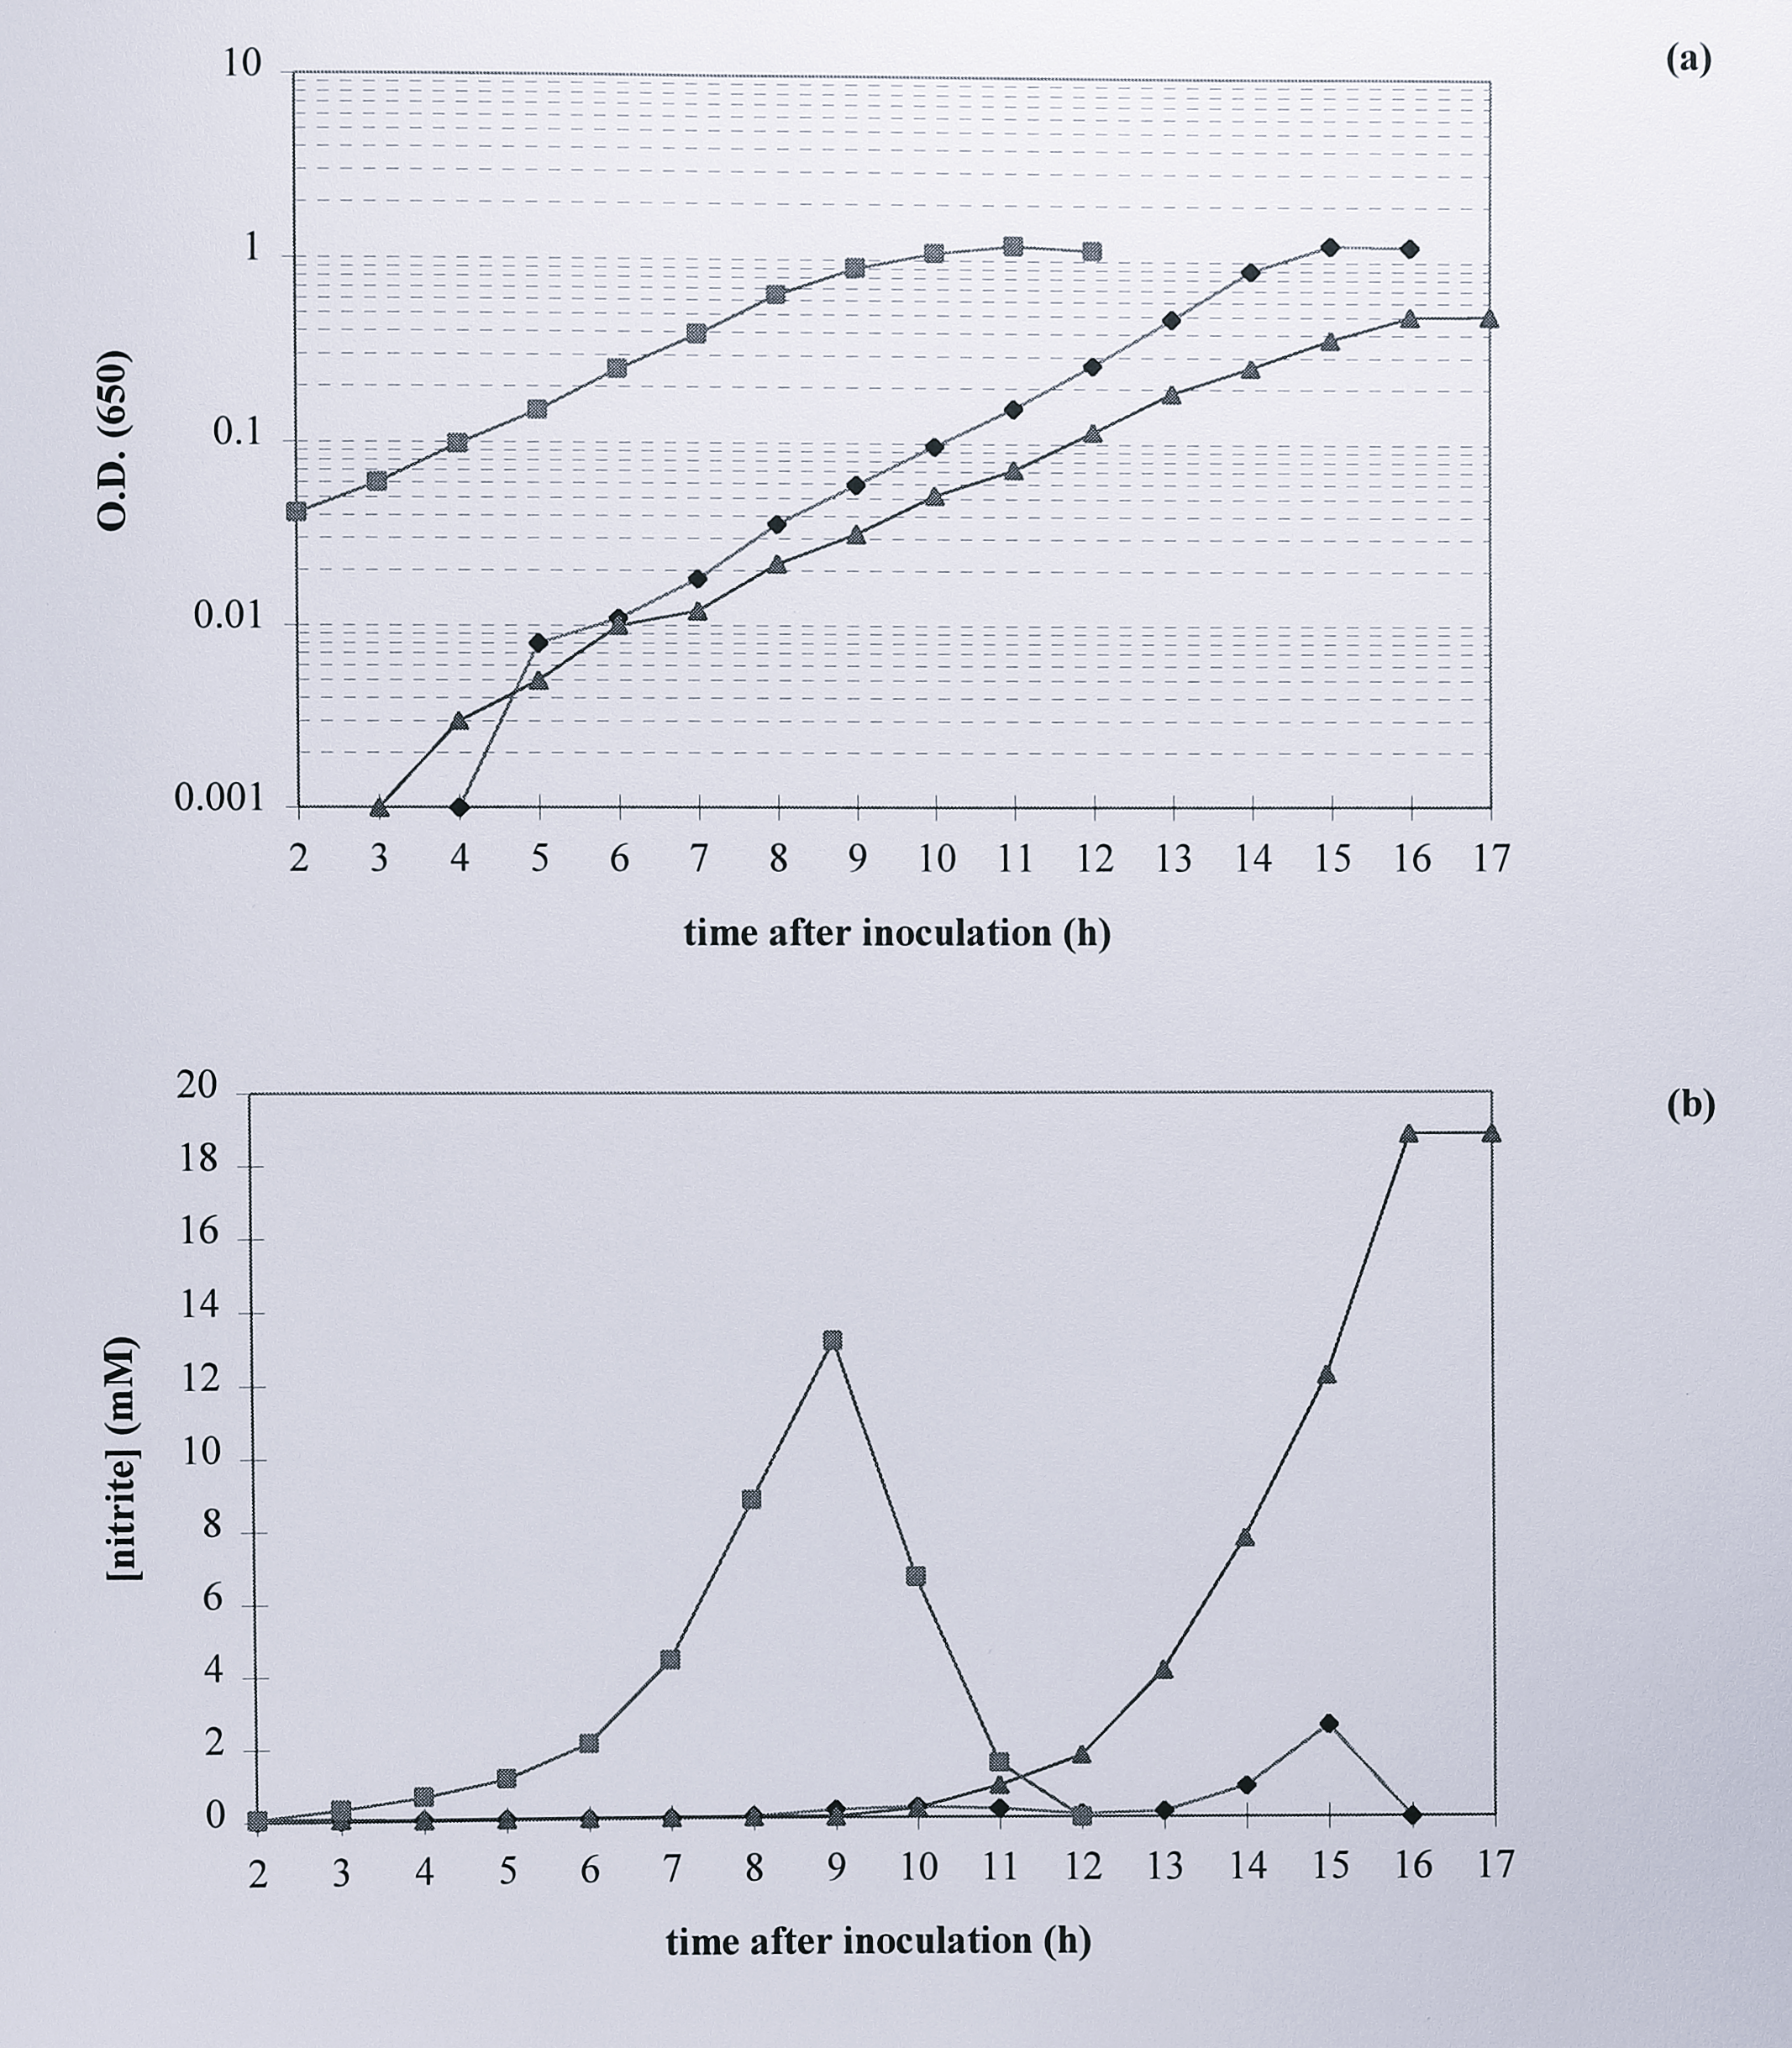
Figure 6.12: Comparison of (a) the anaerobic growth and (b) nitrite accumulation of T. pantotropha with that of T. pantotropha K7 and T. pantotropha \(\Delta7\). Overnight cultures of each strain were inoculated at a dilution of 1/100 into minimal succinate medium plus 20 mM nitrate and growth was monitored by the increase in absorbance at 650 nm (logarithmic scale). 1 ml samples of culture were removed at each time point, centrifuged and the supernatant was assayed colorimetrically for nitrite. Symbols: (◆) T. pantotropha, (■) T. pantotropha K7, (▲) T. pantotropha \(\Delta7\).
Culture medium that contained wild-type T. pantotropha showed a steady rise in nitrite concentration to a maximum of about 3 mM near the end of the exponential growth phase, followed by a rapid decline to undetectable levels in under two hours. A similar process was observed for T. pantotropha K7, although the maximum concentration of nitrite reached was higher at 13 mM. In the unmarked deletion mutant nitrite concentration continued to rise as growth slowed and reached a maximum of almost 20 mM, indicating that almost all the nitrate originally present was converted to nitrite. The cells stopped growing at about the time that maximum nitrite concentration was reached.
After growth, each of the cultures was harvested and a total soluble extract was prepared by sonication and ultracentrifugation. The colour of the cell pellets from each culture differed; the wild-type cells were brown when harvested, whereas cells of T. pantotropha K7 were pink and cells from the deletion mutants were off-white. 40 \(\mu\)g of protein from each extract was separated by SDS-PAGE, transferred to nitrocellulose and probed by Western blotting using mouse antibody to P. denitrificans cytochrome cd\(_1\) (Figure 6.13).
![Western blot of total soluble extracts from wild-type _T. pantotropha_, _T. pantotropha_ K7, _T. pantotropha_ $\Delta7$, T. pantotropha $\Delta7$ [pMMBSEK] and _T. pantotropha_ $\Delta7$ [pMMBY25F] using antibody raised against _P. denitrificans_ cytochrome _cd_$_1$. 40 $\mu$g of protein was loaded in each lane and the samples were separated in a 6% acrylamide SDS-PAGE gel, transferred to nitrocellulose by semi-dry electroblotting and probed using the anti-cytochrome _cd_$_1$ antibody. The 63 kDa band (mature cytochrome _cd_$_1$) and 47 kDa band (truncated cytochrome _cd_$_1$) are indicated by the upper and lower arrows respectively. Lanes: 1, _T. pantotropha_ wild-type, 2, _T. pantotropha_ K7, 3, _T. pantotropha_ $\Delta7$, 4, _T. pantotropha_ $\Delta7$ [pMMBSEK], 5, _T. pantotropha_ $\Delta7$ [pMMBY25F].](figure/fig6-13.png)
Figure 6.13: Western blot of total soluble extracts from wild-type T. pantotropha, T. pantotropha K7, T. pantotropha \(\Delta7\), T. pantotropha \(\Delta7\) [pMMBSEK] and T. pantotropha \(\Delta7\) [pMMBY25F] using antibody raised against P. denitrificans cytochrome cd\(_1\). 40 \(\mu\)g of protein was loaded in each lane and the samples were separated in a 6% acrylamide SDS-PAGE gel, transferred to nitrocellulose by semi-dry electroblotting and probed using the anti-cytochrome cd\(_1\) antibody. The 63 kDa band (mature cytochrome cd\(_1\)) and 47 kDa band (truncated cytochrome cd\(_1\)) are indicated by the upper and lower arrows respectively. Lanes: 1, T. pantotropha wild-type, 2, T. pantotropha K7, 3, T. pantotropha \(\Delta7\), 4, T. pantotropha \(\Delta7\) [pMMBSEK], 5, T. pantotropha \(\Delta7\) [pMMBY25F].
Lanes that contained extract from T. pantotropha and T. pantotropha K7 each contained a band of the same mobility (63 kDa) that corresponded to mature cytochrome cd\(_1\). This band was absent in the extract from T. pantotropha \(\Delta7\) and a new band of lower mobility (approximately 47 kDa) was detected in this extract. The plasmid pMMBSEK (described in Chapter 4) was used to complement the nirS deletion mutant with the wild-type nirS gene. The plasmid contained the nirS gene with its upstream promoter region, as well as a kanamycin resistance gene in the PstI site upstream of the NNR binding site. This arrangement provided a selectable marker in T. pantotropha and also meant that induction using IPTG was unnecessary. Plasmid pMMBSEK was transferred to T. pantotropha \(\Delta7\) by conjugation from E. coli S17-1 and the transconjugants were selected on minimal succinate medium containing 100 \(\mu\)g ml\(^{-1}\) kanamycin. The presence of the plasmid in T. pantotropha \(\Delta7\) was confirmed by plasmid isolation and restriction digests using HindIII (not shown). The transformed cells were grown anaerobically in minimal succinate medium plus nitrate as before and the growth was compared with T. pantotropha, T. pantotropha K7 and T. pantotropha \(\Delta7\) (Figure 6.14).
![Complementation of _T. pantotropha_ $\Delta7$ using plasmid pMMBSEK. Overnight cultures of _T. pantotropha_, _T. pantotropha_ $\Delta7$ and _T. pantotropha_ $\Delta7$ [pMMBSEK] were inoculated at a dilution of 1/100 into minimal succinate medium plus 20 mM nitrate and growth was monitored by the increase in absorbance at 650 nm (logarithmic scale). Symbols: (◆) _T. pantotropha_, (■) _T. pantotropha_ $\Delta7$, (▲) _T. pantotropha_ $\Delta7$ [pMMBSEK].](figure/fig6-14.png)
Figure 6.14: Complementation of T. pantotropha \(\Delta7\) using plasmid pMMBSEK. Overnight cultures of T. pantotropha, T. pantotropha \(\Delta7\) and T. pantotropha \(\Delta7\) [pMMBSEK] were inoculated at a dilution of 1/100 into minimal succinate medium plus 20 mM nitrate and growth was monitored by the increase in absorbance at 650 nm (logarithmic scale). Symbols: (◆) T. pantotropha, (■) T. pantotropha \(\Delta7\), (▲) T. pantotropha \(\Delta7\) [pMMBSEK].
Cells of T. pantotropha \(\Delta7\) that contained pMMBSEK grew normally and reached a similar final optical density to the wild-type culture. The nitrite concentration in the culture medium from T. pantotropha \(\Delta7\) [pMMBSEK] also followed a similar time course to that in wild- type culture (Figure 6.15).
![(a) Anaerobic growth of _T. pantotropha_ $\Delta7$ [pMMBSEK] and (b) nitrite concentration in the medium during growth. An overnight culture of _T. pantotropha_ $\Delta7$ [pMMBSEK] was inoculated 1/100 into minimal succinate medium plus 20 mM nitrate and growth was monitored by the increase in absorbance at 650 nm (logarithmic scale). 1 ml samples were removed at each time point, centrifuged and the supernatant was assayed colorimetrically for nitrite.](figure/fig6-15.png)
Figure 6.15: (a) Anaerobic growth of T. pantotropha \(\Delta7\) [pMMBSEK] and (b) nitrite concentration in the medium during growth. An overnight culture of T. pantotropha \(\Delta7\) [pMMBSEK] was inoculated 1/100 into minimal succinate medium plus 20 mM nitrate and growth was monitored by the increase in absorbance at 650 nm (logarithmic scale). 1 ml samples were removed at each time point, centrifuged and the supernatant was assayed colorimetrically for nitrite.
A soluble extract was prepared from T. pantotropha [pMMBSEK] and probed for cytochrome cd\(_1\) using Western blotting. The expression of mature cytochrome cd\(_1\) was restored to the cells by pMMBSEK and the 63 kDa band stained slightly more strongly in this extract than in the wild-type lane (Figure 6.13). The 47 kDa hand observed in the extract from the deletion mutant T. pantotropha \(\Delta7\) was also observed in the sample from T. pantotropha \(\Delta7\) [pMMBSEK].
6.2.3 Construction of a cytochrome cd\(_1\) mutant in which Tyr-25 is replaced by phenylalanine and expression of the mutant in T. pantotropha \(\Delta7\)
Once it had been demonstrated that the nirS deletion mutant could be complemented successfully using pMMBSEK, the next step was to try to express a site-directed mutant of cytochrome cd\(_1\) using the same system. The first such mutant to be tried was one in which Tyr-25 was replaced with phenylalanine (Y25F). The role of this residue was discussed in Chapter 3 and reasons for the choice of this mutant are discussed further in the next section. The DNA fragment containing the Y25F mutant of cytochrome cd\(_1\) was constructed by Dr. Simon Baker using the Promega Altered Sites II system. The mutagenic plasmid is outlined in Figure 6.16.
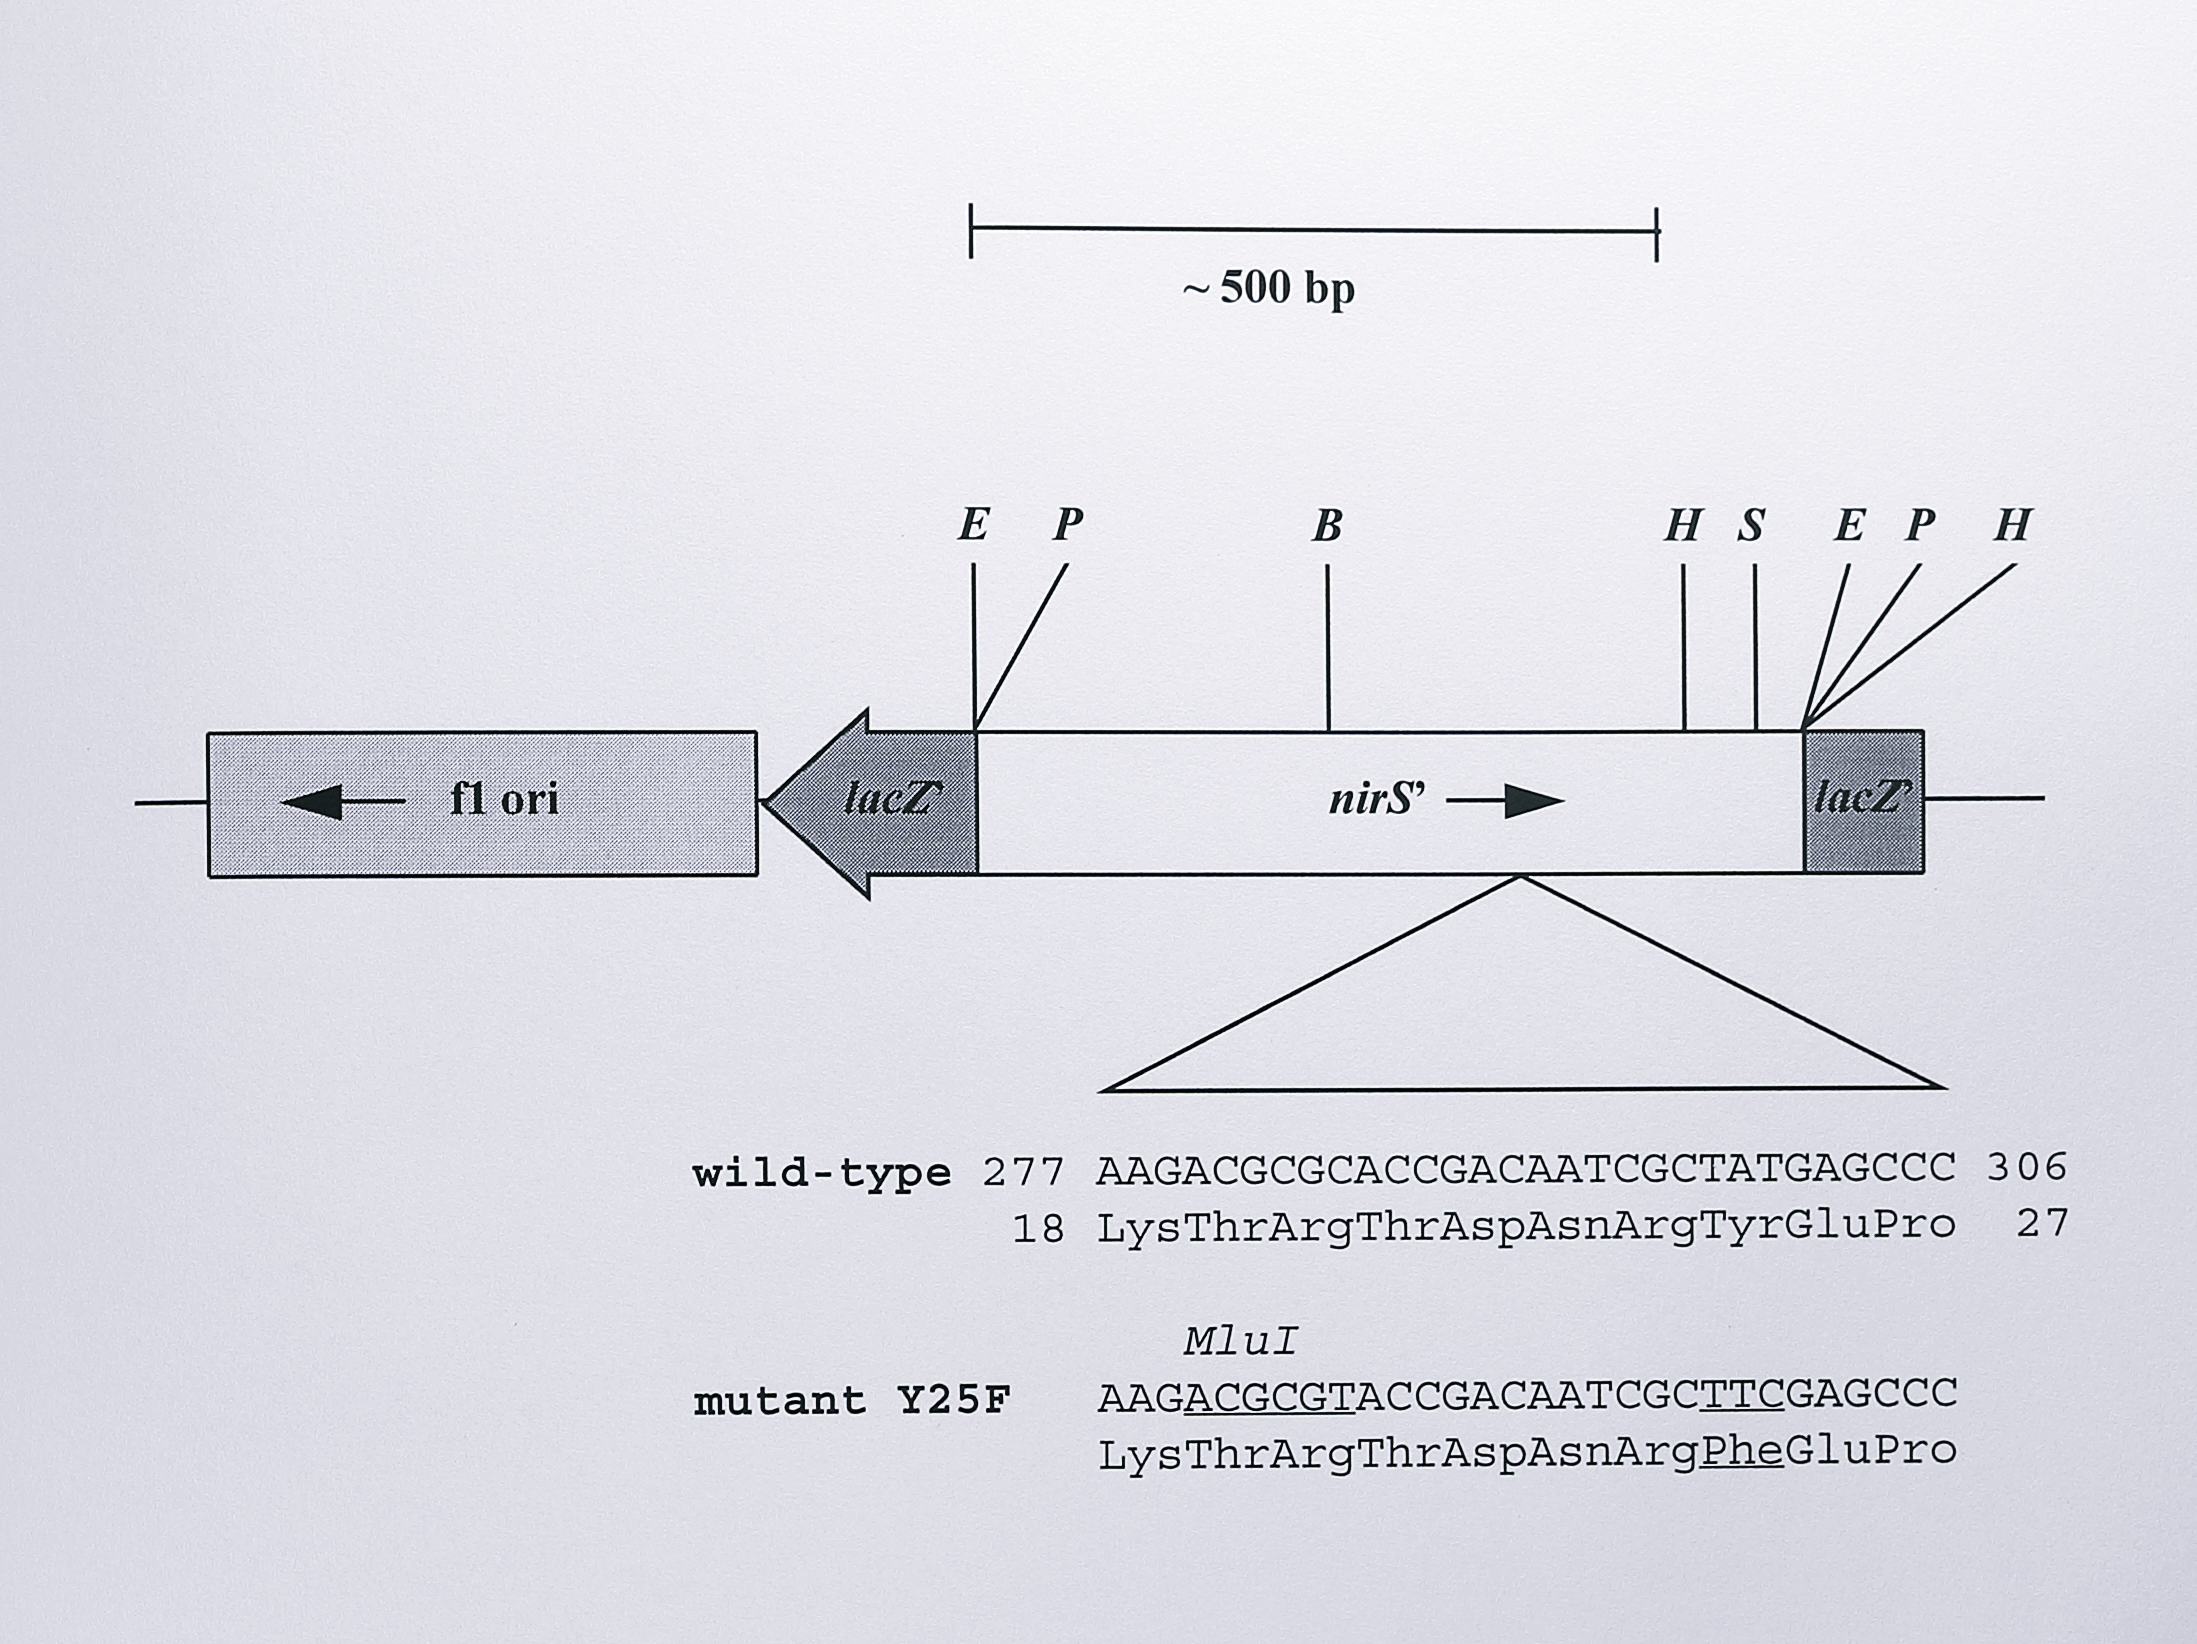
Figure 6.16: Construction of the plasmid pVA191-Y25F containing the Y25F mutation in the nirS gene of T. pantotropha. A 600 bp EcoRI fragment from the plasmid pBNIR (Chapter 4, Table 4.1) containing approximately the first 500 bp of the nirS gene was cloned into the vector pALTER-1. The Promega Altered Sites II site-directed mutagenesis system was then used to anneal a mutagenic oligonucleotide to the gene, substituting phenylalanine for Tyr-25 and introducing a silent MluI restriction site for screening during later manipulations. The insert was then sequenced to check for secondary mutations. The relevant sequence of the gene is shown, with the Y25F and MluI mutations underlined. Enzymes: B, BamHI, E, EcoRI, H, HindIII, P, PstI, S, SalI. Plasmid pVA191-Y25F was constructed by Dr. Simon Baker.
A 600 bp EcoRI fragment from the plasmid pBNIR (Chapter 4, Table 4.1), containing the first 500 bp of the nirS gene was ligated into the plasmid pALTER-1. Tyr-25 was mutated to phenylalanine using a mutant oligonucleotide that additionally contained a silent mutation to introduce a restriction site for MluI into the fragment. The latter mutation allowed for rapid screening of mutant clones during later manipulations and the mutant plasmid was named pVA191-Y25F. The strategy for insertion of the Y25F mutation into the full-length nirS gene is summarised in Figure 6.17.
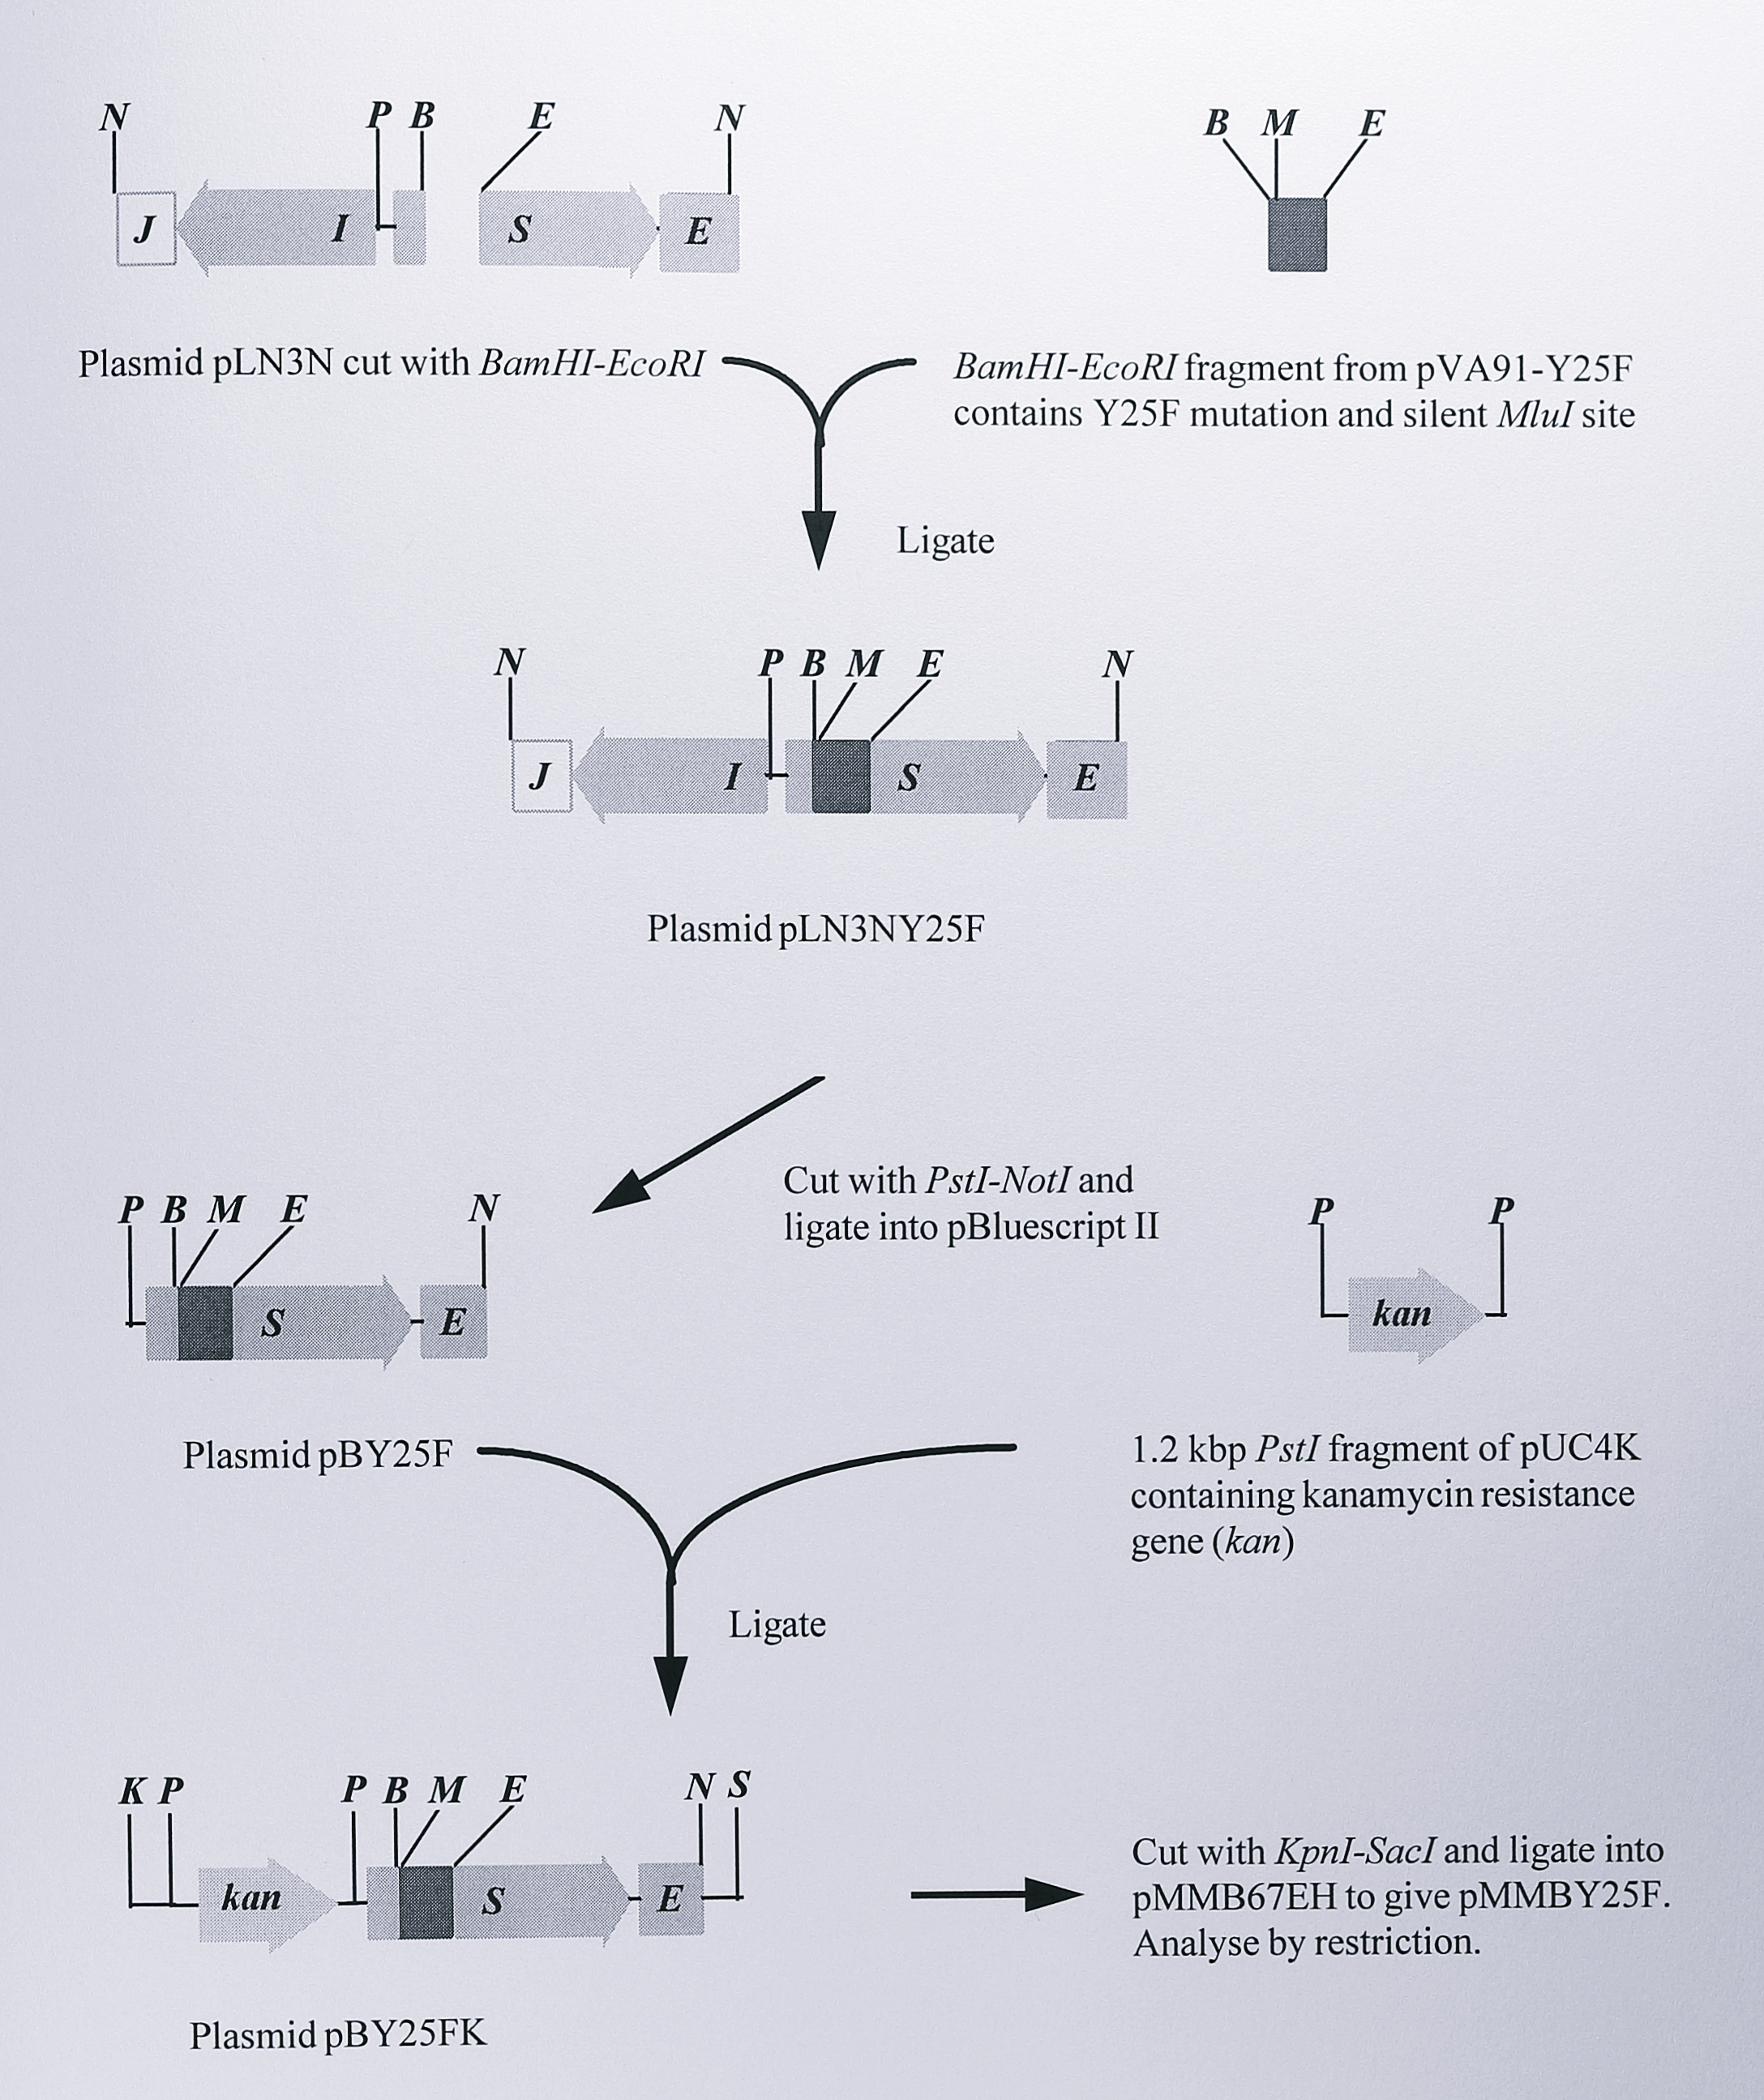
Figure 6.17: Construction of the expression plasmid pMMBY25F containing the Y25F mutation in the nirS gene of T. pantotropha. Only the relevant restriction fragments of each plasmid are shown. Full details of the plasmids are given in Table 6.1. Enzymes: B, BamHI, E, EcoRI, K, KpnI, M, MluI, N, NotI, P, (PstI), S, SacI.
First, a BamHI - EcoRI fragment was removed from pVA191-Y25F. This fragment carried the Y25F mutation and was the same 382 bp of DNA that was removed from the nirS gene to construct unmarked deletion mutants described in Section 6.2.1. The 382 bp fragment was ligated into the plasmid pLN3N after first removing the equivalent fragment from the cloned nirS gene in pLN3N and the new plasmid, designated pLN3NY25F was screened for the presence of the new MluI site. The nirS gene containing the Y25F mutation was then cut from pLN3NY25F as a 2.4 kbp PstI - NotI fragment and ligated into the vector pBluescript II KS(+) which had been cut using the same enzymes. This construct was named pBY25F and was analysed by restriction digestion and by partial sequencing using the 610F primer (Chapter 3, Table 3.1) to confirm the cloning (Figure 6.18).
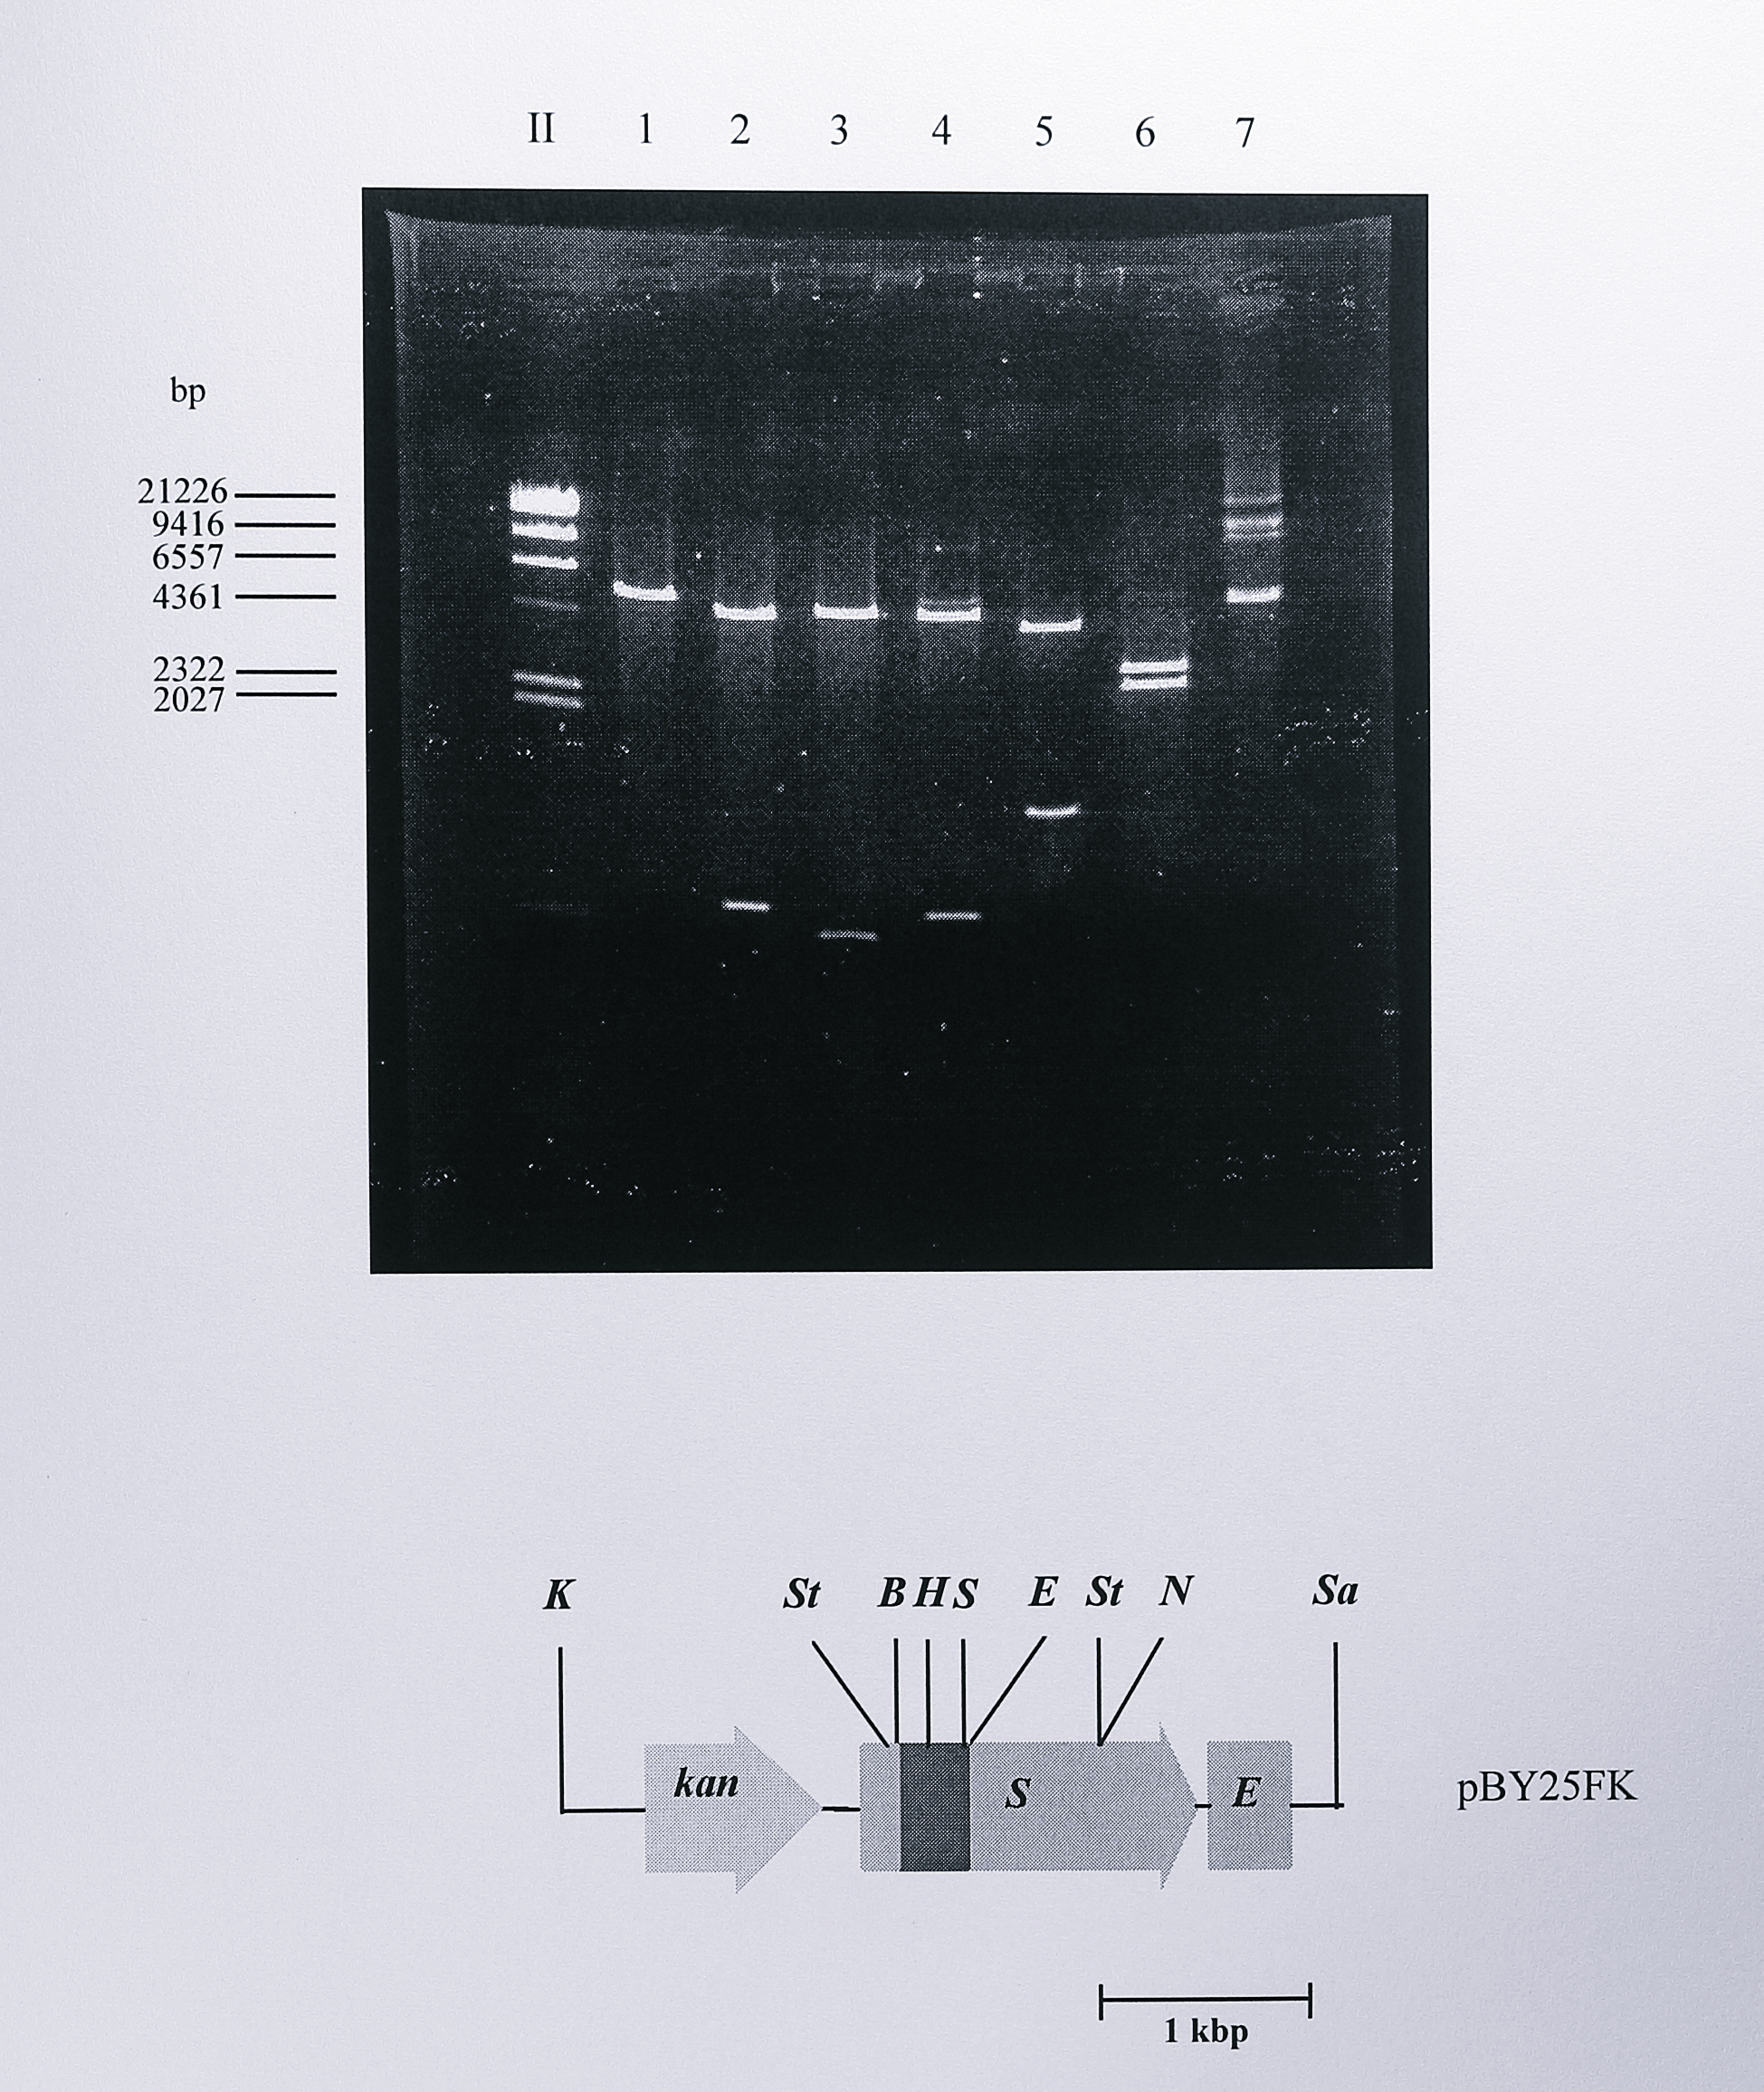
Figure 6.18: Restriction digest analysis of plasmid pBY25FK. Following ligation and transformation, plasmid DNA was isolated from the transformed cells and digested using BamHI (lane 1), EcoRI (lane 2), HindIII (lane 3), SalI (lane 4), StyI (lane 5), KpnI - SacI (lane 6) and NruI (lane 7). Plasmid pBY25F from which pBY25FK was derived had previously been screened for the presence of the mutagenic MluI site. The pBluescript (II) vector contained one additional site for EcoRI, HindIII and SalI. Analysis of the digests showed that the construct was correct as shown in the diagram below the gel. Enzymes: B, BamHI, E, EcoRI, H, HindIII, K, KpnI, N, NruI, S, SalI, Sa, SacI, St, StyI. The lane labelled II contained DNA size standards, some of which are indicated at the left of the gel.
To construct an expression plasmid containing the nirS Y25F mutant gene, the 1.2 kbp PstI fragment from pUC4K containing the kanamycin resistance gene was ligated into the PstI site of pBY25F and a 3.7 bp KpnI - SacI fragment containing this marker together with the mutated nirS gene was ligated into the broad host range vector pMMB67EH that had been cut with the same enzymes. The final plasmid, pMMBY25F, was thus identical to pMMBSEK except for the Y25F mutation in the nirS gene and was checked by digestion using MluI (Figure 6.19).
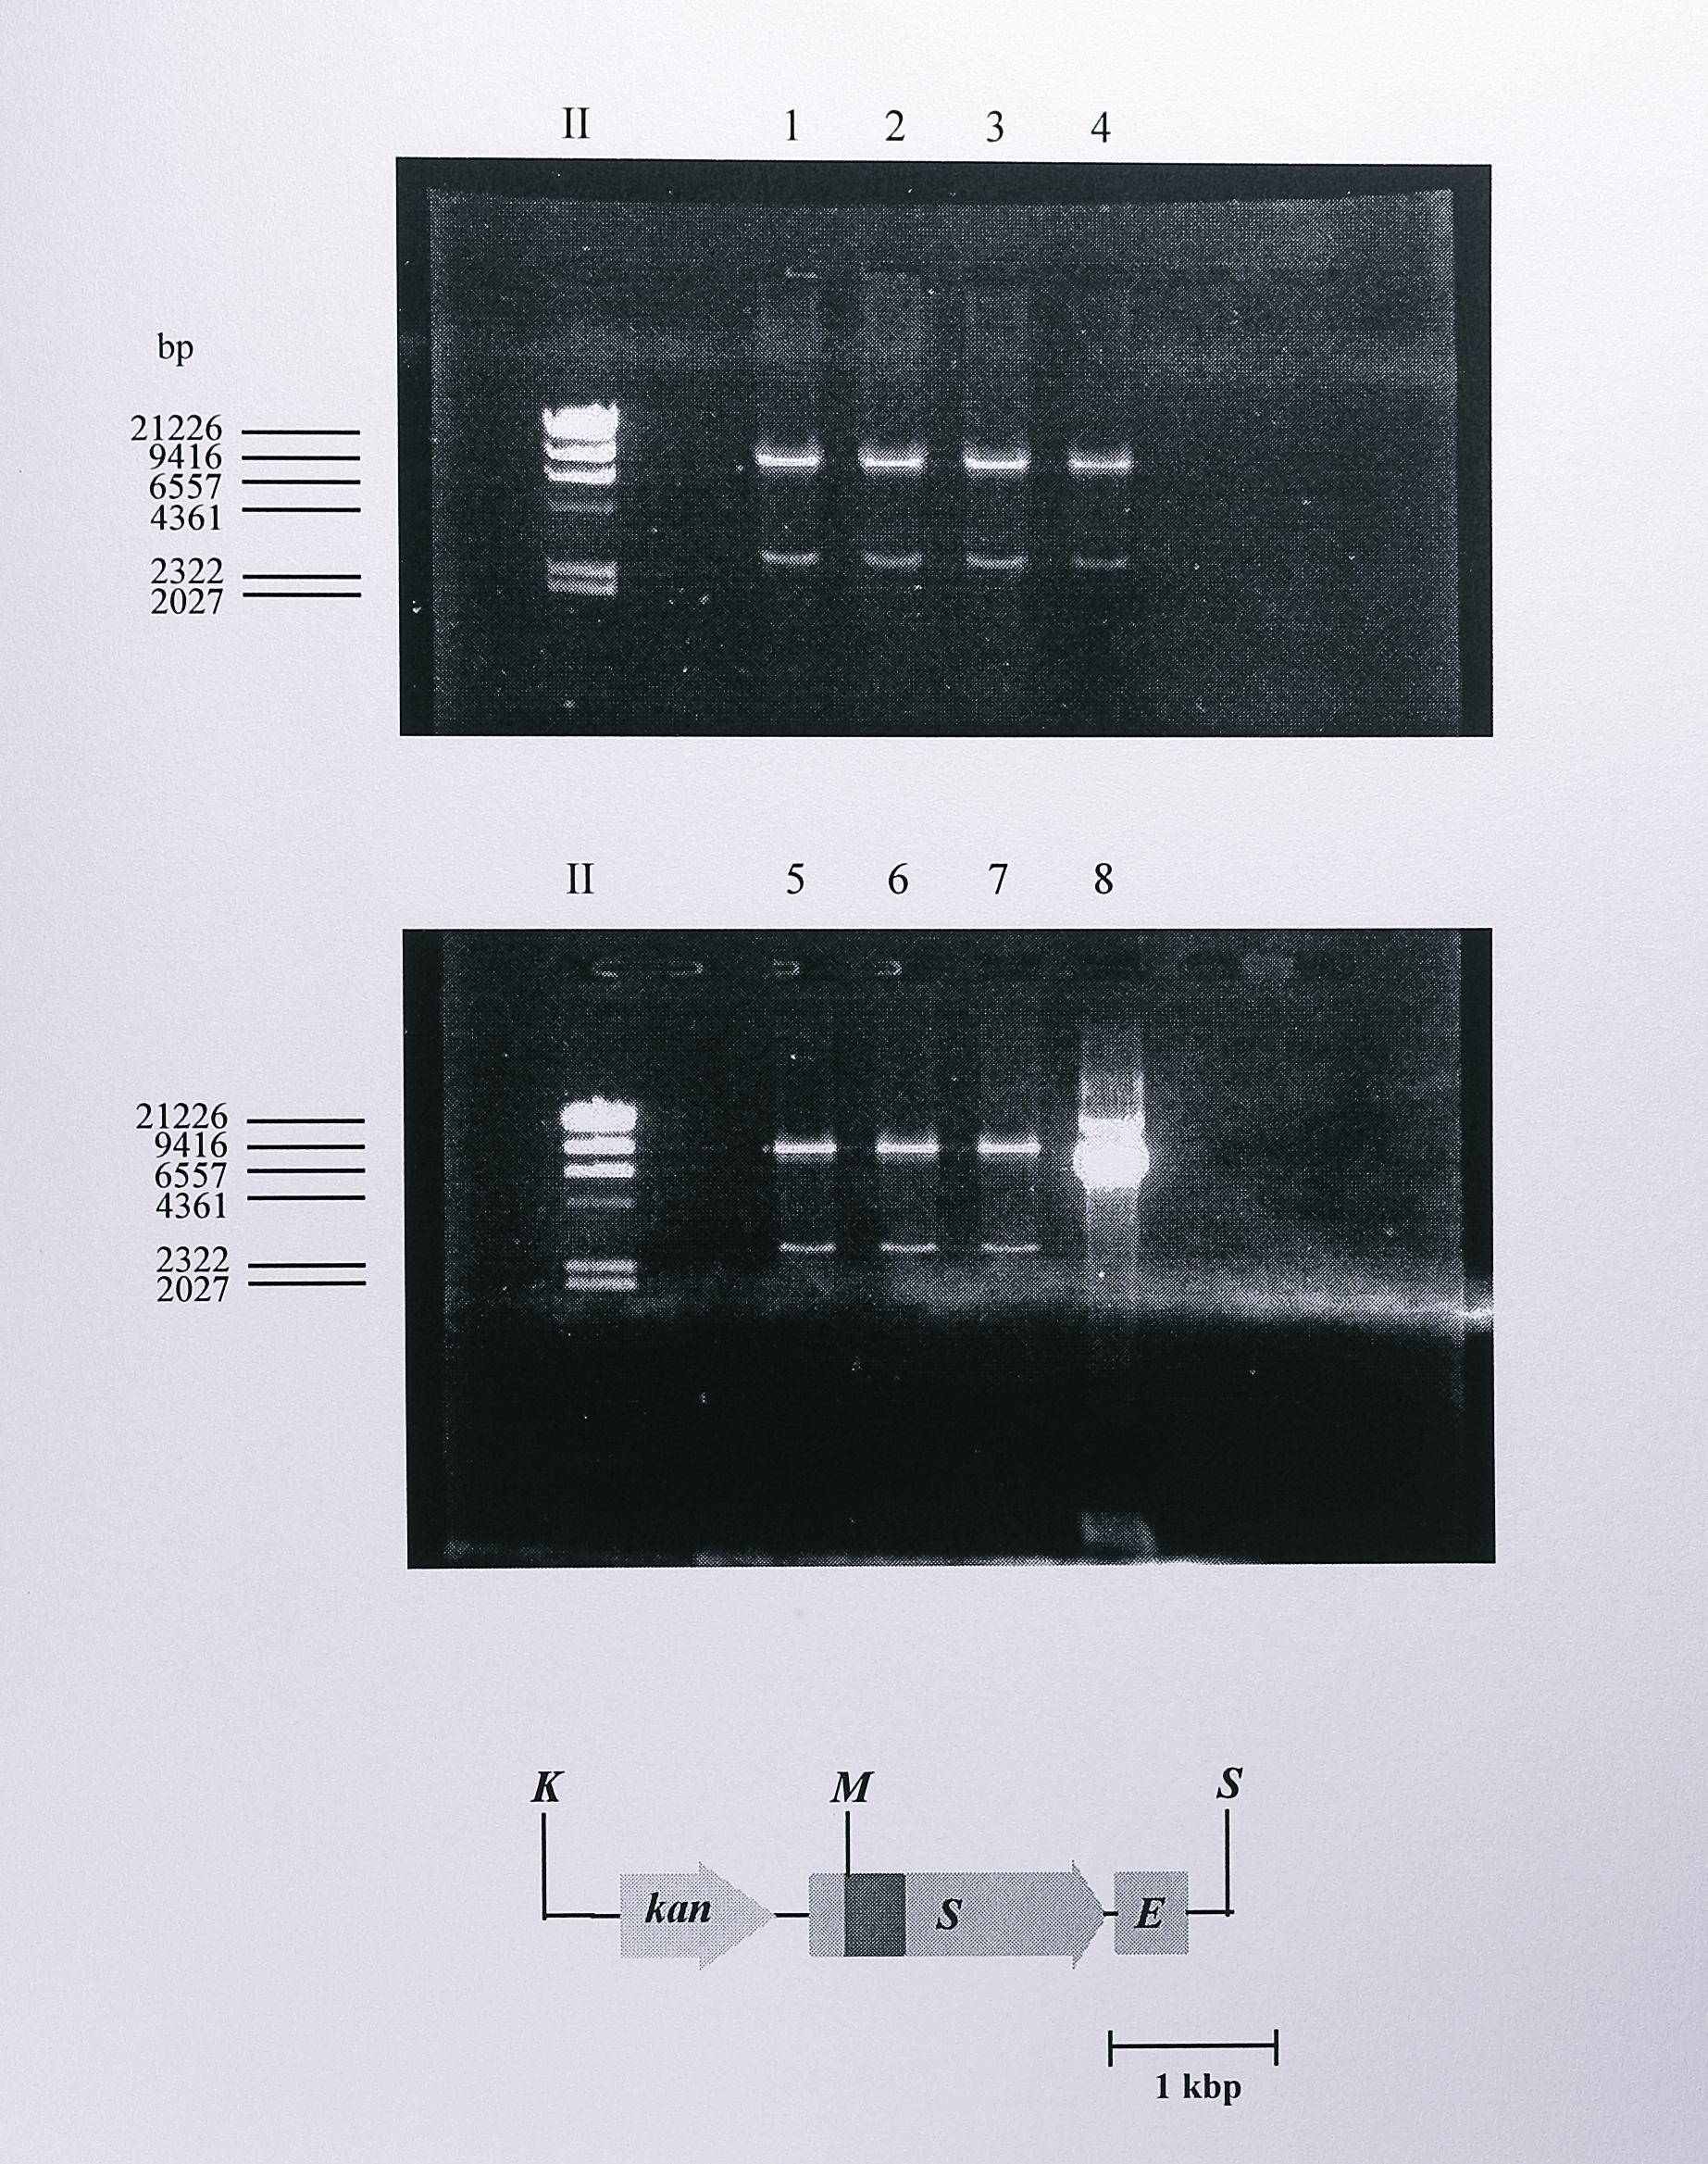
Figure 6.19: Restriction digest analysis of plasmid pMMBY25F using MluI. Following ligation and transformation, plasmid DNA was isolated from the transformed cells and digested using MluI to check for the presence of the Y25F mutation in the nirS gene. Plasmid pMMB67EH into which the KpnI - SacI insert from pBY25FK was cloned contains a single MluI site, so this digest generated two fragments of approximate sizes 10.3 and 2.8 kbp, seen in lanes 1-7. Enzymes: K, KpnI, M, MluI, S, SacI. The lane labelled II contains DNA size standards, some of which are indicated at the left of the gel.
pMMBY25F was transferred to T. pantotropha \(\Delta7\) by conjugal transfer from E. coli S17-1 and the transconjugants were selected on minimal succinate medium containing 100 \(\mu\)g ml\(^{-1}\) kanamycin. T. pantotropha \(\Delta7\) [pMMBY25F] was then grown anaerobically in minimal succinate medium plus nitrate containing 100 \(\mu\)g ml\(^{-1}\) kanamycin (Figure 6.20a).
![Comparison of (a) anaerobic growth and (b) nitrite accumulation in _T. pantotropha_ $\Delta7$ [pMMBY25F] compared with that of _T. pantotropha_, _T. pantotropha_ $\Delta7$ and _T. pantotropha_ $\Delta7$ [pMMBSEK]. Overnight cultures of each strain were inoculated at a dilution of 1/100 into minimal succinate media plus 20 mM nitrate and growth was monitored by the increase in absorbance at 650 nm (logarithmic scale). 1 ml samples of each culture were removed at each time point and assayed colorimetrically for nitrite. Symbols: (◆) _T. pantotropha_, (■) _T. pantotropha_ $\Delta7$, (▲) _T. pantotropha_ $\Delta7$ [pMMBSEK], (x) _T. pantotropha_ $\Delta7$ [pMMBY25F].](figure/fig6-20.png)
Figure 6.20: Comparison of (a) anaerobic growth and (b) nitrite accumulation in T. pantotropha \(\Delta7\) [pMMBY25F] compared with that of T. pantotropha, T. pantotropha \(\Delta7\) and T. pantotropha \(\Delta7\) [pMMBSEK]. Overnight cultures of each strain were inoculated at a dilution of 1/100 into minimal succinate media plus 20 mM nitrate and growth was monitored by the increase in absorbance at 650 nm (logarithmic scale). 1 ml samples of each culture were removed at each time point and assayed colorimetrically for nitrite. Symbols: (◆) T. pantotropha, (■) T. pantotropha \(\Delta7\), (▲) T. pantotropha \(\Delta7\) [pMMBSEK], (x) T. pantotropha \(\Delta7\) [pMMBY25F].
Growth of T. pantotropha \(\Delta7\) [pMMBY25F] was virtually indistinguishable from that of the deletion mutants. Additionally, nitrite accumulated in the culture medium of T. pantotropha [pMMBY25F] to almost 20 mM just as was seen in the deletion mutant cultures (Figure 6.20b). A total soluble extract was prepared from T. pantotropha \(\Delta7\) [pMMBY25F] and probed for cytochrome cd\(_1\) by Western blotting as described earlier (Figure 6.13). The 63 kDa band that corresponded to mature cytochrome cd\(_1\) was much fainter in this extract than in the extracts from wild-type, T. pantotropha K7 or T. pantotropha \(\Delta7\) [pMMBSEK] and the 47 kDa band seen in the extracts from the deletion mutant was also present.
Although the cytochrome cd\(_1\) Y25F mutant appeared to be inactive (as cultures of T. pantotropha \(\Delta7\) [pMMBY25F] accumulated nitrite as though nitrite reductase were absent) and present in low amounts, partial purification of the protein was attempted. 20 l of T. pantotropha \(\Delta7\) [pMMBY25F] was grown anaerobically overnight, harvested and spheroplasted to give 94 ml of periplasmic extract. The extract was bound to a DEAE Sepharose column and eluted using a linear gradient of NaCl. Elution of haem proteins was followed by measuring the absorbance of the fractions at 410 nm (Figure 6.21).
![Elution profile during ion exchange chromatography of soluble extract from anaerobically grown _T. pantotropha_ $\Delta7$ [pMMBY25F]. 20 l of _T. pantotropha_ $\Delta7$ [pMMBY25F] were grown anaerobically in minimal succinate medium plus 20 mM nitrate. A total soluble extract prepared from the cells was bound to a DEAE-Sepharose column (2 x 20 cm) and eluted with a 350 ml linear gradient of 0-400 mM NaCl in 50 mM Tris-HCl pH 8.0 (◆). Elution of haem proteins was followed by measuring the absorbance of the fractions at 410 nm (■). Elution of the blue copper protein pseudoazurin in fractions 28-35 was monitored by absorbance at 595 nm (▲). The three major elution peaks are labelled numbers 2-4. As described in the text, a fourth _c_-type cytochrome eluted from the column either in the early fractions or during washing. In the above experiment this protein eluted during washing and was collected; however it is still referred to as peak 1.](figure/fig6-21.png)
Figure 6.21: Elution profile during ion exchange chromatography of soluble extract from anaerobically grown T. pantotropha \(\Delta7\) [pMMBY25F]. 20 l of T. pantotropha \(\Delta7\) [pMMBY25F] were grown anaerobically in minimal succinate medium plus 20 mM nitrate. A total soluble extract prepared from the cells was bound to a DEAE-Sepharose column (2 x 20 cm) and eluted with a 350 ml linear gradient of 0-400 mM NaCl in 50 mM Tris-HCl pH 8.0 (◆). Elution of haem proteins was followed by measuring the absorbance of the fractions at 410 nm (■). Elution of the blue copper protein pseudoazurin in fractions 28-35 was monitored by absorbance at 595 nm (▲). The three major elution peaks are labelled numbers 2-4. As described in the text, a fourth c-type cytochrome eluted from the column either in the early fractions or during washing. In the above experiment this protein eluted during washing and was collected; however it is still referred to as peak 1.
A pink band that bound weakly to the column was eluted during washing in some trials, or in the early part of the gradient in others; in Figure 6.21 this peak is not visible as it eluted during the wash, but it is referred to as Peak 1. Three other major peaks (2-4) eluted from the column at approximately 100, 150 and 220 mM NaCl respectively; these peak fractions were coloured pink, yellow-brown and dark brown respectively. Additionally, a blue coloured peak eluted from the column at approximately 50 mM NaCl; this peak was recorded by measuring its absorbance at 595 nm as shown in Figure 6.21. 15 \(\mu\)l of the fraction from the top of Peaks 1-4 was separated by SDS-PAGE and stained in order to identify c-type cytochromes (Figure 6.22).
![SDS-PAGE gel of fractions eluting from the DEAE-Sepharose column during chromatography of soluble extract from _T. pantotropha_ $\Delta7$ [pMMBY25F], stained for _c_-type cytochromes. 15 $\mu$l of the top fraction from each peak was loaded on a 15% acrylamide SDS-PAGE gel, electrophoresed and stained for covalently-attached haem. The lane numbers refer to the peaks in Figure 6.21. Estimated molecular weights of the bands determined from an identical Coomassie-stained gel are indicated at the left of the gel.](figure/fig6-22.png)
Figure 6.22: SDS-PAGE gel of fractions eluting from the DEAE-Sepharose column during chromatography of soluble extract from T. pantotropha \(\Delta7\) [pMMBY25F], stained for c-type cytochromes. 15 \(\mu\)l of the top fraction from each peak was loaded on a 15% acrylamide SDS-PAGE gel, electrophoresed and stained for covalently-attached haem. The lane numbers refer to the peaks in Figure 6.21. Estimated molecular weights of the bands determined from an identical Coomassie-stained gel are indicated at the left of the gel.
The weakly-binding pink fractions under Peak 1 contained a c-type cytochrome with a molecular weight of approximately 16 kDa. Peaks 2, 3 and 4 also contained c-type cytochromes with molecular weights on SDS-PAGE of 17, 12 and 45 kDa respectively. Peaks 1 and 3 did not stain strongly when Coomassie Blue was used to stain the gel (not shown). UV-visible spectroscopy was used to characterise further the coloured fractions. As isolated, peak 1 exhibited absorbance maxima at 406 and 528 nm (Figure 6.23a).
![Visible spectra of an unidentified _c_-type cytochrome from _T. pantotropha_ [pMMBY25F]. As isolated, peak 1 showed absorbance maxima at 406 and 528 nm (a). When reduced with dithionite in the presence of air, the cytochrome auto-oxidised rapidly. Reduction under argon produced new absorbance maxima at 416, 521 and 550 nm (b). The spectra are characteristic of a cytochrome _c_.](figure/fig6-23.png)
Figure 6.23: Visible spectra of an unidentified c-type cytochrome from T. pantotropha [pMMBY25F]. As isolated, peak 1 showed absorbance maxima at 406 and 528 nm (a). When reduced with dithionite in the presence of air, the cytochrome auto-oxidised rapidly. Reduction under argon produced new absorbance maxima at 416, 521 and 550 nm (b). The spectra are characteristic of a cytochrome c.
The cytochrome auto-oxidised rapidly after reduction using sodium dithionite, but when the reduction was performed under argon, absorbance maxima appeared at 416, 521 and 550 nm (Figure 623b). Fractions from under peak 1 had no nitrate reductase, nitrite reductase or cytochrome c oxidase activities (not shown). Spectroscopy of peaks 2 (Figure 6.24a) and 3 (Figure 6.24b) after reduction with sodium dithionite identified them as cytochrome c\(_{550}\) and cytochrome c’ respectively.
![Visible spectra of (a) cytochrome _c_$_{550}$ and (b) cytochrome _c_' from _T. pantotropha_ [pMMBY25F]. Peak 2 had absorbance maxima at 415, 522 and 550 nm when reduced. It was identified by spectroscopy, elution position and size on SDS-PAGE as cytochrome _c_$_{550}$. Peak 3 had absorbance maxima at 410, 500 and 604 nm when reduced and showed a shoulder to the red side of the peak at 410 nm. It was identified as being cytochrome _c_' using the methods employed to identify cytochrome _c_$_{550}$.](figure/fig6-24.png)
Figure 6.24: Visible spectra of (a) cytochrome c\(_{550}\) and (b) cytochrome c’ from T. pantotropha [pMMBY25F]. Peak 2 had absorbance maxima at 415, 522 and 550 nm when reduced. It was identified by spectroscopy, elution position and size on SDS-PAGE as cytochrome c\(_{550}\). Peak 3 had absorbance maxima at 410, 500 and 604 nm when reduced and showed a shoulder to the red side of the peak at 410 nm. It was identified as being cytochrome c’ using the methods employed to identify cytochrome c\(_{550}\).
The spectrum of the dark-brown coloured peak 3 exhibited absorbance maxima at 408, 526 and 639 nm as isolated (Figure 6.25a) and at 419, 524, 556 and 620 nm when reduced with sodium dithionite (Figure 6.25b).
![Visible spectra of cytochrome _c_ peroxidase from _T. pantotropha_ [pMMBY25F]. Peak 4 as isolated showed absorbance maxima at 408, 526 and 639 nm. When reduced with sodium dithionite, absorbance maxima were seen at 419, 524, 556 and 620 with a shoulder at the blue side of the 556 nm peak. Peak 4 was identified by spectroscopy, size on SDS-PAGE and enzyme assay as cytochrome _c_ peroxidase.](figure/fig6-25.png)
Figure 6.25: Visible spectra of cytochrome c peroxidase from T. pantotropha [pMMBY25F]. Peak 4 as isolated showed absorbance maxima at 408, 526 and 639 nm. When reduced with sodium dithionite, absorbance maxima were seen at 419, 524, 556 and 620 with a shoulder at the blue side of the 556 nm peak. Peak 4 was identified by spectroscopy, size on SDS-PAGE and enzyme assay as cytochrome c peroxidase.
These spectra strongly resembled the published spectra of cytochrome c peroxidase from P. denitrificans [316] and when assayed the peak 3 fractions did have a significant peroxidase activity, oxidising 3.2 \(\mu\)mol of horse heart cytochrome c per minute per \(\mu\)l of fraction in the presence of 18 \(\mu\)M H\(_2\)O\(_2\) (Figure 6.26).
Figure 6.26: Assay of cytochrome c peroxidase activity in peak 4 following ion exchange chromatography. The assay was performed in a volume of 1 ml, containing 50 mM Tris-HCl pH 8.0, 25 \(\mu\)M horse heart cytochrome c and varying volumes of the fractions from the top of peak 4. After incubation of these components for 1 minute to reduce the peroxidase (Gilmour et al., 1994), the reaction was initiated by the addition of 18 \(\mu\)M H\(_2\)O\(_2\). Oxidation of cytochrome c was followed by the decrease in absorbance at 550 nm.
In addition to the cytochrome-containing fractions, the blue fractions 28-35 were identified by visible spectroscopy as the small copper protein pseudoazurin (Figure 6.27).
![Visible spectrum of pseudoazurin from _T. pantotropha_ [pMMBY25F]. Fractions 28-35 (Figure 6.21) were coloured pale-blue. The blue material had absorbance maxima at 408, 587 and 739 nm as isolated. Although the spectrum does not exactly match published spectra for pseudoazurin from _T. pantotropha_ [@moir_purification_1993], it could be identified by size on SDS-PAGE and elution position. The peak at 408 nm overlays a peak at 450 nm and probably indicates contamination of the pseudoazurin peak by the small cytochrome _c_ in peak 1.](figure/fig6-27.png)
Figure 6.27: Visible spectrum of pseudoazurin from T. pantotropha [pMMBY25F]. Fractions 28-35 (Figure 6.21) were coloured pale-blue. The blue material had absorbance maxima at 408, 587 and 739 nm as isolated. Although the spectrum does not exactly match published spectra for pseudoazurin from T. pantotropha [101], it could be identified by size on SDS-PAGE and elution position. The peak at 408 nm overlays a peak at 450 nm and probably indicates contamination of the pseudoazurin peak by the small cytochrome c in peak 1.
However, no elution peak that corresponded to cytochrome cd\(_1\) was observed in several trials. A cytochrome cd\(_1\) elution peak was also absent when a hydrophobic phenyl Sepharose column was employed as the first purification step (not shown).
6.3 Discussion
The method used to construct an unmarked deletion in the nirS gene of T. pantotropha has been used previously in the closely-related organism P. denitrificans PD1222 to mutate a number of genes including those encoding amicyanin [313], cytochrome c\(_{551i}\), cytochrome c\(_{550}\) and cytochrome c\(_{553i}\) [314], the cytochrome c oxidases aa\(_3\) and cbb\(_3\) [317] and the genes moxJ and moxG which are involved in methanol oxidation [318]. The method has a number of advantages as compared to simple insertional mutagenesis using an antibiotic resistance cassette; first, in-frame deletions can be constructed in order to prevent polar effects on genes downstream of the mutated target gene and, second, the method allows for the construction of multiple mutations by the repeated insertion of a kanamycin marker into several targets followed by its replacement with the unmarked deletion. This is especially important for P. denitrificans in which few selectable markers have been reported [259].
The first step of the mutagenic procedure, insertion of the kanamycin cassette into the PstI site upstream of nirS, was accomplished quite easily. A large number of kanamycin resistant transconjugants were selected after mating and 15 out of 100 of these proved to be exconjugants when tested for spectinomycin susceptibility. This compares well with the frequency of 40% reported for kanamycin insertion mutagenesis of the cycA gene in P. denitrificans [312]. The ease of this procedure was probably due in part to the extensive homologous regions each side of the kanamycin cassette in the mutagenic plasmid pGRPN3K, in which there was approximately 5.1 kbp and 2.1 kbp of DNA upstream and downstream respectively of the kanamycin cassette. It has been suggested that at least 1 kb of homologous DNA each side of the insertion region is desirable for efficient homologous recombination of both arms in P. denitrificans (Dr. Simon Baker, personal communication). Southern blotting using the labelled kanamycin cassette showed clearly that the fragment has inserted only once into the chromosome and the hybridisation of the fragment to genomic DNA digested with HindIII indicated that the insertion was at the correct site. This was confirmed by hybridisation of the labelled nirS gene fragment to DNA digested using StyI, although in this experiment hybridisation to the larger of the two expected fragments was very weak, probably due to the low region of overlap between the large fragment and the small nirS-derived probe.
The second step of the method, replacement of the nirS gene and the kanamycin marker by an unmarked mutation was somewhat more difficult to achieve. This was largely due to difficulties experienced in ligating the blunted NotI fragment from pLN3N\(\Delta\)nir into the blunt-ended SmaI site of pRVS1. Eventually this cloning was achieved by blunting the NotI ends using T7 DNA polymerase. Restriction analysis of the plasmid pRVS\(\Delta\)nir was complicated by the lack of a published restriction map for this plasmid and by the observation that with certain enzymes (e.g. PstI) an anomalous restriction pattern was observed in which the sizes of the fragments produced did not appear to add up to the total size of the plasmid (11.6 kbp). However, the correctness of the construct was confirmed by a combination of restriction and PCR analyses, and ultimately by Southern blotting of the mutants obtained and their subsequent analysis. In future it would be advantageous to engineer fragments for cloning into pRVS1 to have the appropriate restriction sites at their termini and to have a detailed restriction map of the plasmid.
Replacement of the chromosomal nirS gene with the unmarked deletion also proved to be quite challenging. To begin with, the procedure for selection of cells in which pRVS\(\Delta\)nir had become integrated into the chromosome proved to be slightly different to the published protocol [312], in that a concentration of 20 \(\mu\)g ml\(^{-1}\) of X-Gal in the plates was not sufficient to turn the colonies blue. At 40 \(\mu\)g ml\(^{-1}\) the colonies were pale-blue. However, the presence of spectinomycin and kanamycin, both at 100 \(\mu\)g ml\(^{-1}\), should have been sufficient to detect plasmid integrant strains. In the next stage of the published protocol cells are scraped from these plates, replated in the absence of antibiotics to promote excision of the plasmid from the chromosome, then collected once more and plated in the presence of a high X-Gal concentration to detect exconjugants, which colour white under these conditions. In the case of T. pantotropha very few white colonies were obtained in this way, and so a single colony was grown for two cycles in liquid culture to promote recombinational excision of the plasmid. The number of white colonies obtained was increased but was still very low; 25 were obtained after the second culture was diluted 10\(^7\) fold and plated on 10 plates, of which three colonies were kanamycin-sensitive and contained the deletion. The frequency is somewhat lower than that reported for deletion mutagenesis of the cycA gene in P. denitrificans (resolution frequency of 5 x 10\(^{-4}\), of which 25% were kanamycin-sensitive [312].
Growth of the deletion mutant strains revealed the expected phenotype as compared with the wild-type cells; in the absence of cytochrome cd\(_1\) the nitrite produced by nitrate reductase activity accumulates rapidly to levels beyond which the cells no longer grow. It is notable that the maximum nitrite concentration reached was practically equal to that of the nitrate supplied originally in the medium, indicating that even if the cells are not growing nitrate reductase activity is able to continue quite efficiently. The peak nitrite concentration reached in cultures containing the kanamycin insertion was somewhat higher than in the wild-type strain, indicating that nitrite reduction in this strain was impaired. On a Western blot, slightly less cytochrome cd\(_1\) was observed in this mutant strain, and when harvested, the cells were noticeably pink compared to the wild-type. The kanamycin insertion lies in the promoter region of the nirI gene, which is known to be involved in the regulation of nirS expression [169]. It is probable that in this mutant expression of nirI is impaired but not abolished, allowing the formation of some active cytochrome cd\(_1\). The pink colour of the cell pellet is possibly due to the expression of some semi-apo cytochrome cd\(_1\), which is pink as it lacks the d\(_1\) haem, and/or to the attenuated level of holo-cytochrome cd\(_1\) which normally colours the cell pellet brown.
Western blotting of the cell extracts from the deletion mutants showed that cytochrome cd\(_1\) was absent, but revealed the presence of a new band with an approximate molecular weight of 47 kDa. This band was specific to the deletion mutant and cells derived from it (it was also observed in T. pantotropha \(\Delta7\) carrying the plasmids pMMBSEK and pMMBY25F, but not in the extracts from wild-type cells or from T. pantotropha K7). The most likely explanation for this band is that it represents a truncated form of cytochrome cd\(_1\) generated by the removal of the 382 bp BamHI - EcoRI fragment. During the latter procedure the cohesive termini generated by restriction using these enzymes were filled in using T4 DNA polymerase. Without sequencing across this junction it is not possible to know precisely what junction was formed, as the polymerase may have removed some nucleotides from either terminus as well as filling in the ends. However, analysis of the truncated gene using the program SeqAid [319] indicates that the procedure may have generated two new open reading frames. The first of these begins at the original ATG start codon and is 264 bp long, encoding for 88 amino acids and is unlikely to be relevant. The second begins at an ATG codon after the deletion and encodes a polypeptide of 429 amino acids long (47.8 kDa) and this protein may be the species that is cross-reacting on the Western blot. The presence of this polypeptide is not significant in terms of the later complementation and mutagenesis experiments as it is unlikely to be periplasmic in the absence of a targeting sequence, is clearly not active and does not contain the region in which the Y25F mutation was made and so could not exchange this residue with the mutated residue on plasmid pMMBY25F.
Complementation of the deletion mutant T. pantotropha \(\Delta7\) using the plasmid pMMBSEK was successful, as shown by the restoration of growth on nitrate and the presence of the cytochrome cd\(_1\) polypeptide by Western blotting. The latter technique showed that there was a significant, but not excessive, increase in the amount of expressed protein from the plasmid as compared with the chromosomal copy of the gene, indicating that the copy number is quite low in T. pantotropha as was discussed in Chapter 5. The increased levels of cytochrome cd\(_1\) do not seem to have had a deleterious effect on the regulation of denitrification in the cells as judged by analysis of the growth curves and of nitrite levels in the culture medium, both of which were very similar to wild-type cultures. pMMBSEK proved to be a good choice of plasmid for these experiments; it contains the kanamycin resistance gene which is selectable in T. pantotropha and the upstream promoter region which seems to be fully functional, removing the need for induction using IPTG. The last point is important as the tac promoter is believed to function quite poorly in P. denitrificans (Dr. M.L.D. Page and Dr. E. Gordon, personal communication).
Having demonstrated that the nirS deletion mutant could be complemented successfully with a plasmid the next step was to try complementation using a site-directed mutant of the nirS gene. The first mutant chosen was one in which Tyr-25 was mutated to phenylalanine. The role of Tyr-25 was discussed in Chapter 3; it is a ligand to the d\(_1\) haem in the oxidised enzyme structure and is postulated to displace nitric oxide from the haem iron during the catalytic cycle of nitrite reduction [127]. This crucial role made Tyr-25 an attractive candidate for mutagenesis. Phenylalanine was chosen as a replacement residue as it has the same core structure as tyrosine, lacking only the hydroxyl group; the latter feature would be expected to prevent bonding to the d\(_1\) haem iron. Additionally, Tyr-25 is located on the 382 bp BamHI - EcoRI fragment that was removed from the chromosomal nirS gene to make the deletion mutant. This facilitated the construction of the mutant as the same fragment could be inserted into the expression plasmid as a cassette and screened for using the silent MluI restriction site. The absence of the residue in the chromosomal copy of the gene also meant that it could not be transferred to the plasmid by homologous recombination, although the probability of this kind of transfer is quite low and can always be monitored by isolation of the plasmid from the cells and restriction analysis or sequencing. One other possibility is that of reversion, in which the Y25F mutant of the nirS gene might be transferred to the chromosome by homologous recombination and then repaired by random mutation to give the wild-type gene. However, this is most unlikely as the amount of homologous overlapping DNA between the plasmid and the chromosome is quite low, especially at the 5’-end and, additionally, reversion is extremely rare in P. denitrificans except under conditions of extreme selective pressure [259].
Growth of T. pantotropha \(\Delta7\) [pMMBY25F) anaerobically on nitrate showed a phenotype that was virtually identical to that of the deletion mutants, with poor growth and an accumulation of nitrite to toxic levels. This was taken initially as evidence that the expressed protein was not active. However, Western blotting showed that only very low amounts of the protein were present. This might have been a consequence of the low yield of cells (an ideal control experiment at this stage, although not possible in the present work, would have been to compare the level of cytochrome cd\(_1\) to that in cells in which denitrification was impaired due to another cause, such as mutations in other electron transfer components), but the amount of cytochrome cd\(_1\) seemed abnormally low even taking the poor growth into account. To investigate this further 20 l of cells were grown and partial purification of cytochrome cd\(_1\) was attempted from a periplasmic extract. Despite several trials no cytochrome cd\(_1\) was isolated from a DEAE-Sepharose ion-exchange column in these experiments. By contrast the amounts of cytochrome c\(_{550}\) and cytochrome c’ (proteins that are normally observed during cytochrome cd\(_1\) purification) seemed to be close to or even slightly higher than what would have been expected when taking into account the reduced growth of the cells as compared to wild-type cultures. These results indicate that the Y25F mutation resulted in a greatly attenuated level of expressed cytochrome cd\(_1\), perhaps as a result of degradation of the protein. Unfortunately, this result does not allow a definite conclusion as to whether Tyr-25 is essential for the enzymatic activity of cytochrome cd\(_1\), since it was not possible to isolate sufficient quantities of the mutant enzyme for kinetic analyses. However, as the mutant was expressed in vivo in T. pantotropha, it can be stated that Tyr-25 is certainly a vital residue in some sense. One possible reason for the postulated degradation could be that Tyr-25 plays an important structural role during assembly of the enzyme. As well as ligating to the d\(_1\) haem iron, Tyr-25 is hydrogen-bonded via a water molecule to the residues His-345 and His-388 in the oxidised structure of cytochrome cd\(_1\) [264] and so is structurally important. It may be that some or all of the above interactions are important during the assembly and folding of cytochrome cd\(_1\) in vivo and that their absence in the Y25F mutant accounts for its degradation. However, an equally valid argument is that the absence of enzymatic activity in the Y25F mutant leads to the degradation of the enzyme as the cells experience increasingly non-physiological conditions because of the accumulation of nitrite. Notably, Tyr-25 is disordered in the reduced structure of cytochrome cd\(_1\), which is likely to be the physiologically-relevant form (Chapter 3) and so at least some degree of complementation using pMMBY25F might have been expected, had the Y25F mutant been active.
The growth of T. pantotropha \(\Delta7\) [pMMBY25F] is essentially identical to that of the deletion mutant alone and some interesting observations can be made concerning the cytochrome content of the cells. First, a small c-type cytochrome was observed (approximately 16 kDa on SDS-PAGE) which bound only weakly to the DEAE-Sepharose column, stained poorly with Coomassie Blue and auto-oxidised following reduction using sodium dithionite. This cytochrome has not been observed previously during purification of cytochrome cd\(_1\) from wild-type cultures of T. pantotropha and its function is unknown. The spectrum of the cytochrome did not correspond to any known published spectrum of c-type cytochromes from P. denitrificans or other organisms, and so N-terminal sequencing would be a useful first step in an attempt to identify this protein. It may be expressed as a consequence of stress placed on the cells by the high nitrite concentration. Further evidence that the mutant cells grown under these conditions are under some form of oxidative stress was deduced from the elevated levels of cytochrome c peroxidase found in the cells. Normally this protein is seen only as a small absorbance at 410 nm eluting just before cytochrome cd\(_1\) from the DEAE-Sepharose column when wild-type cells are grown anaerobically with nitrate. However, in the mutant culture cytochrome c peroxidase was the major c-type cytochrome. It was also notable that elevated levels of the small blue copper protein pseudoazurin were present, giving a blue colour to the fractions in which the protein eluted that was clearly visible to the eye. Although the yield of pseudoazurin from wild-type T. pantotropha has been reported as 0.6 mg l\(^{-1}\) [240], the protein has been consistently difficult to detect during routine purification of cytochrome cd\(_1\) over the course of the present work. The amounts observed in this case seem especially significant when the poor cell yield is considered. This observation may indicate that pseudoazurin is produced in response to oxidative stress and/or it may be an electron donor to cytochrome c peroxidase in an analogous role to the similar protein azurin [320].
The complementation of the nirS deletion mutant using pMMBSEK has shown that this is a viable expression system for cytochrome cd\(_1\), provided that the recombinant protein is stable. Although the growth of the cells is poor the final optical density is still equivalent to that of wild-type cells in early exponential phase and the yield of other cytochromes from the ion-exchange column indicates that enough cytochrome cd\(_1\) could be obtained for further studies, provided that it was not degraded. It may also be possible to increase the cell yield by dialysis culture to remove the toxic nitrite produced or by simply growing larger culture volumes. However, the potential instability of mutants such as Y25F presents a different problem. As the mutant cytochrome cd\(_1\) could not be isolated from scaled-up cultures, it was not possible to find out whether Tyr-25 was an essential residue for catalysis. This question might be answered using the reconstitution of the expressed semi-apo protein from E. coli that was described in Chapter 4. In this case the assembly of the protein differs to that in vivo, in that it does not depend on the presence of Tyr-25 to ligand with the d\(_1\) haem during synthesis and folding because the d\(_1\) haem is not present. It may therefore be possible to insert the haem by reconstitution into semi-apo cytochrome cd\(_1\) Y25F and determine whether the protein is catalytically active. The comments from Chapter 4 concerning improvements to the expression system and standardisation of the reconstitution protocol are equally valid here. Additionally, there are a large number of other potential targets for site-directed mutagenesis that may still be tried using expression in T pantotropha \(\Delta7\) or in E. coli. These include His-17 which is the proximal ligand to the c-haem in the oxidised structure, Met-106, the proximal c-haem ligand in the reduced structure and His-345 or His-388, which are believed to act as proton donors during the dehydration of nitrite at the active site. The first two of these lie in the 382 bp deleted region of the nirS gene and could be constructed in much the same way as the Y25F mutant described in this chapter.