Chapter 7 Transcriptional analysis of the nirS gene from T. pantotropha
7.1 Introduction
Transposon mutagenesis and the use of heterologous gene probes have led to the identification of gene clusters containing over thirty genes involved in denitrification in Ps. stutzeri Zobell, Ps. aeruginosa and P. denitrificans [168]. Some of these genes have been well characterised, in particular the structural genes that encode the enzymes of denitrification and some of the accessory genes involved in their biosynthesis such as those involved in the assembly of the d\(_1\) haem group in cytochrome cd\(_1\) [321]. However, very little transcriptional analysis of denitrification gene operons has been reported. Most of the work in this field has been performed in Ps. stutzeri Zobell. In this organism, transcription start site analysis has been reported for the genes fnrA [206], norCB [322] and nosZ [221] and Northern blotting has been used to determine the major transcripts from these genes. Northern blotting of transcripts from the nirS gene region has also been reported [222]. Similar analysis of the nor genes [323] and the nirK gene which encodes a copper nitrite reductase [324] have been performed using Rhodobacter sphaeroides. In other cases sequence analysis has been employed, as in the nir operon of Ps. aeruginosa [223] to look for transcription terminator features that might indicate the size of gene transcripts. In P. denitrificans transcriptional analysis is very much in its infancy; very few genes have had their transcription start sites determined and little is known about the promoter regions of any gene family. More experimental data from P. denitrificans would be extremely valuable as much of the regulation of denitrification is likely to occur at the level of transcription. Identification of promoters and the proteins that interact with them could improve our understanding of how denitrifying organisms sense environmental factors such as oxygen tension and nitrate concentration and co-ordinate the expression of the many genes involved in denitrification.
The experiments described in this chapter had two objectives: first to measure the size of the transcript from the nirS gene and second, to determine the transcription start site using two different methods. Following discussion of the results an analysis of NNR dependent genes is presented with the aim of discussing some of the possible ways in which the transcription of the nirS gene may be regulated. Finally, some ideas for future experiments in this area are discussed.
7.2 Results
The starting material for the experiments described in this chapter was total RNA extracted from T. pantotropha that had been grown anaerobically to mid-exponential phase. The extraction method was based on a number of methods rather than on one specific protocol; cell lysis under denaturing conditions and phenol-chloroform extraction was based on the method of Chattopadhyay et al. (1993) [249]. A 50 ml culture typically yielded 150-200 \(\mu\)g of total RNA with a ratio of absorbances at A\(_{260}\):A\(_{280}\) of 1.5-1.9, which is considered to be of sufficient quality for further work [325]. The extracted total RNA was separated using denaturing formaldehyde agarose gel electrophoresis to determine whether degradation had occurred during the extraction procedure. Figure 7.1 shows a gel containing a sample of RNA from T. pantotropha that has been run alongside a total RNA extract from Escherichia coli (prepared in the same way as that from T. pantotropha) and a sample of total RNA from human cells (obtained from Dr. Stuart Wilson, University of Oxford).
![Analysis of total RNA samples from human cells, _E. coli_ and _T. pantotropha_ using denaturing agarose gel electrophoresis. Total RNA samples from human HeLa cells (lane 1, 10 $\mu$g, obtained from Dr. Stuart Wilson, University of Oxford), _E. coli_ (lane 2, 10 $\mu$g) and _T. pantotropha_ (lane 3, 15 $\mu$g from anaerobically grown cells and lane 4, 15 $\mu$g from aerobically grown cells) were denatured by heating in 50% formamide as described by Grierson (1990) [@griersen_notitle_1991] and electrophoresed in a 1% agarose-formaldehyde gel. The samples were stained by adding ethidium bromide at 0.033 $\mu$g/$\mu$l to the sample loading buffer. The sizes of RNA size standards (not visible on the photograph) are indicated at the left of the gel. Ribosomal RNA sizes (28S = 4718 bases, 23S = 2904 bases, 18S = 1874 bases, 16S = 1541 bases) are shown at the right of the gel.](figure/fig7-1.png)
Figure 7.1: Analysis of total RNA samples from human cells, E. coli and T. pantotropha using denaturing agarose gel electrophoresis. Total RNA samples from human HeLa cells (lane 1, 10 \(\mu\)g, obtained from Dr. Stuart Wilson, University of Oxford), E. coli (lane 2, 10 \(\mu\)g) and T. pantotropha (lane 3, 15 \(\mu\)g from anaerobically grown cells and lane 4, 15 \(\mu\)g from aerobically grown cells) were denatured by heating in 50% formamide as described by Grierson (1990) [326] and electrophoresed in a 1% agarose-formaldehyde gel. The samples were stained by adding ethidium bromide at 0.033 \(\mu\)g/\(\mu\)l to the sample loading buffer. The sizes of RNA size standards (not visible on the photograph) are indicated at the left of the gel. Ribosomal RNA sizes (28S = 4718 bases, 23S = 2904 bases, 18S = 1874 bases, 16S = 1541 bases) are shown at the right of the gel.
Under these conditions two bright bands of ribosomal RNA and a faint smear of messenger RNA should be observed. In the case of E. coli the 23S and 16S ribosomal RNA molecules are 2904 [327] and 1541 nucleotides long [328], respectively. Undegraded RNA should exhibit a 2:1 staining ratio for the 23S and 16S rRNA species [325]. The sample from T. pantotropha contained two strongly-staining bands of RNA, but the upper band ran with the same mobility as the 16S RNA species whereas the lower band was smaller, with an estimated size of approximately 900 bases. This result is discussed further in the following section, but it results from the fragmentation of the 23S rRNA molecule and in this case does not indicate that the RNA is degraded.
The length of the nirS transcript was determined using Northern blotting. For this experiment 5, 10 and 20 \(\mu\)g samples of total RNA from T. pantotropha were separated by electrophoresis on a 1% formaldehyde-agarose gel and transferred to a positively charged nylon membrane by capillary transfer using 20x SSC. The lane containing RNA size standards was removed from the blot and stained using methylene blue. The transferred RNA was then hybridised with a DNA probe of 141 bp in length, which had been generated from T. pantotropha genomic DNA using a PCR reaction with the primers nirSF and 228R (Table 3.1, Chapter 3). The probe was labelled with dUTP-digoxigenin-alkaline phosphatase conjugate. Following hybridisation and washing, the hybridised probe was visualised colorimetrically using a stain for the conjugated alkaline phosphatase activity (Figure 7.2).
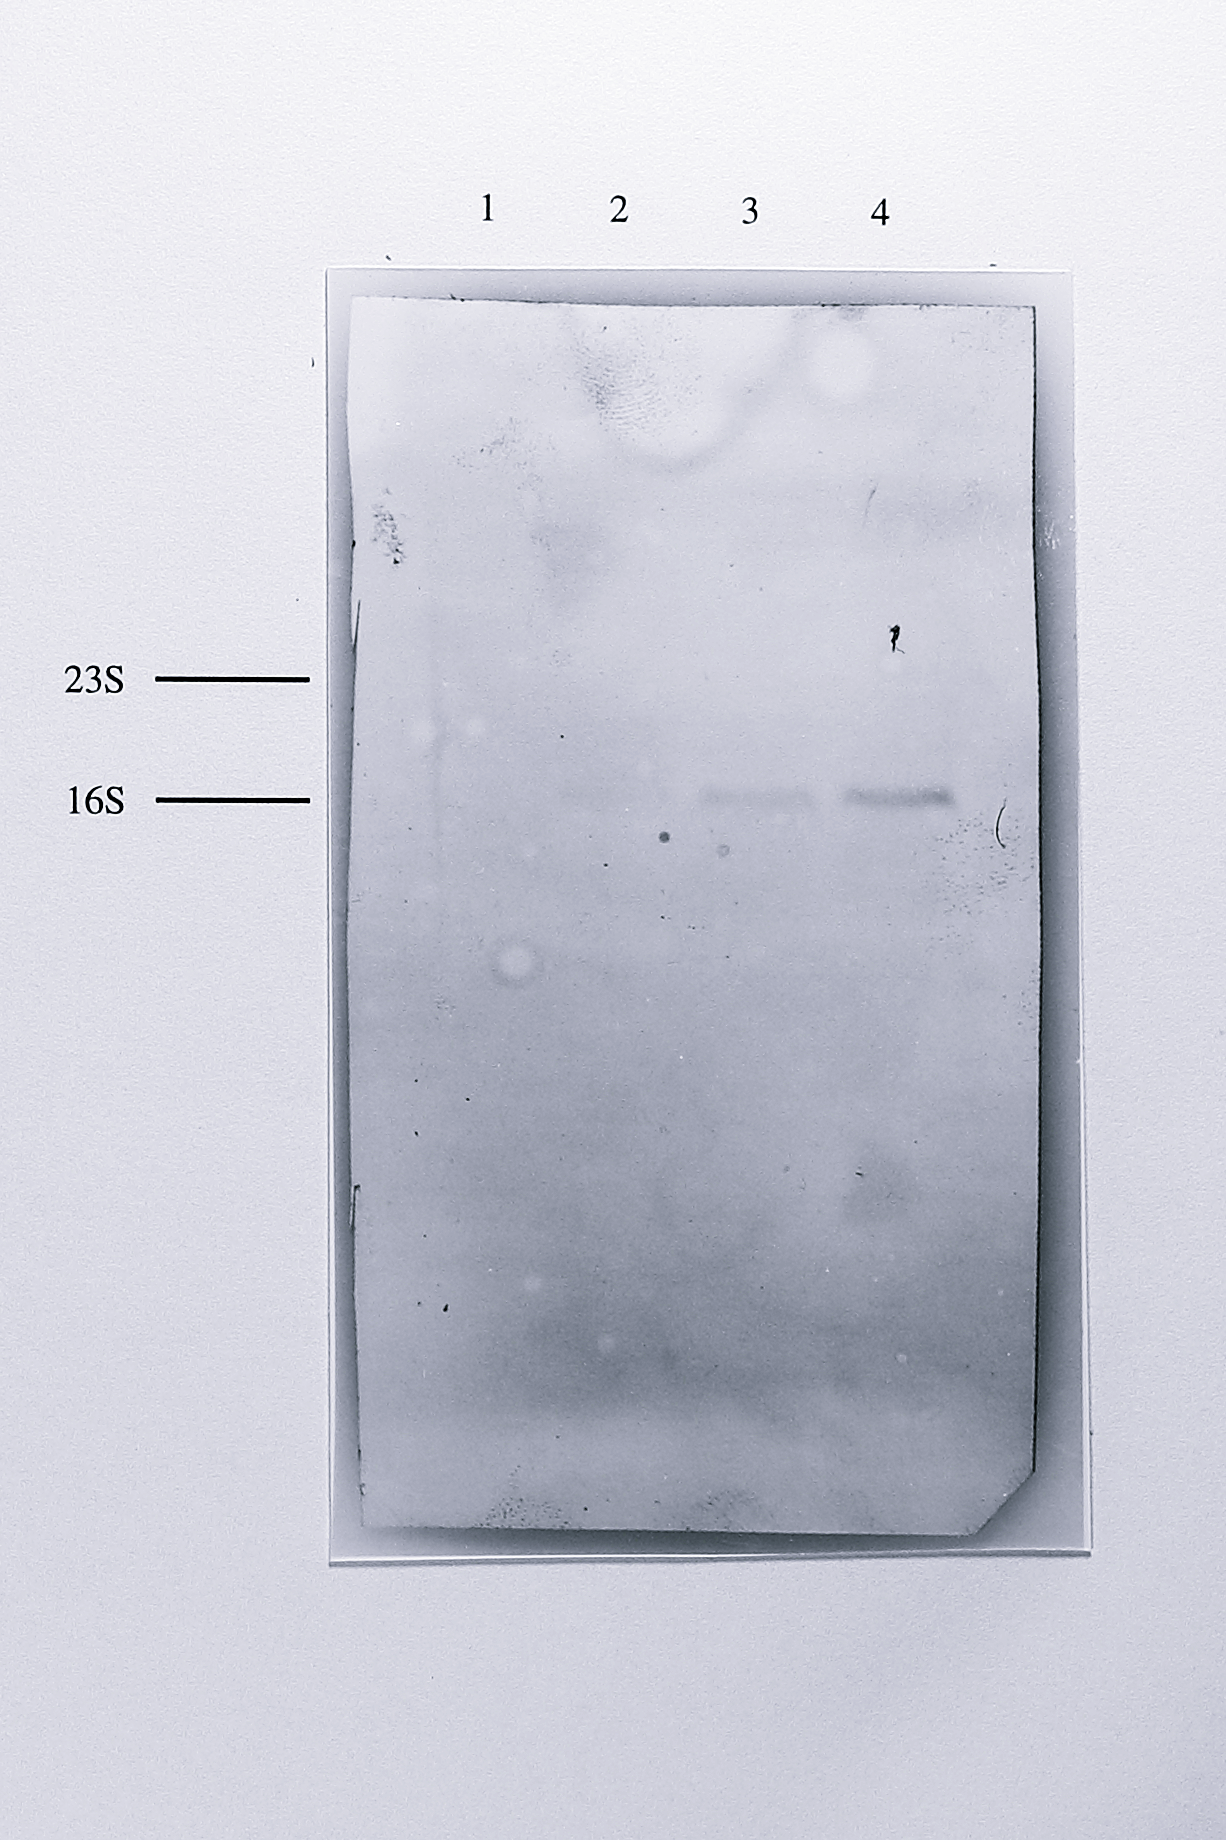
Figure 7.2: Northern blot of total RNA from anaerobically grown T. pantotropha using a nirS-derived probe. 10 \(\mu\)g of RNA from E. coli (lane 1) and 5, 10 and 20 \(\mu\)g of RNA from anaerobically grown T. pantotropha (lanes 2-4) were separated by electrophoresis on a 1% agarose-formaldehyde gel transferred to a positive nylon membrane and hybridised with a probe to the nirS gene, labelled with digoxigenin alkaline-phosphatase conjugate. After washing, the hybridised probe was detected colorimetrically. A single band with a mobility of approximately 1.85 kb was detected in the lanes containing RNA from T. pantotropha. The relative positions of the 23S (2904 bases) and 16S (1542 bases) ribosomal RNA species are shown at the left of the blot.
In all lanes a single band with an approximate size of 1.85 kb was detected. Northern blotting was also performed using chemiluminescent detection of the probe with the alkaline phosphatase substrate CSPD. This technique is several times more sensitive than the colorimetric detection method and was used to look for minor transcripts of different sizes. However, only the same 1.85 kb band was detected in these experiments (Figure 7.3).
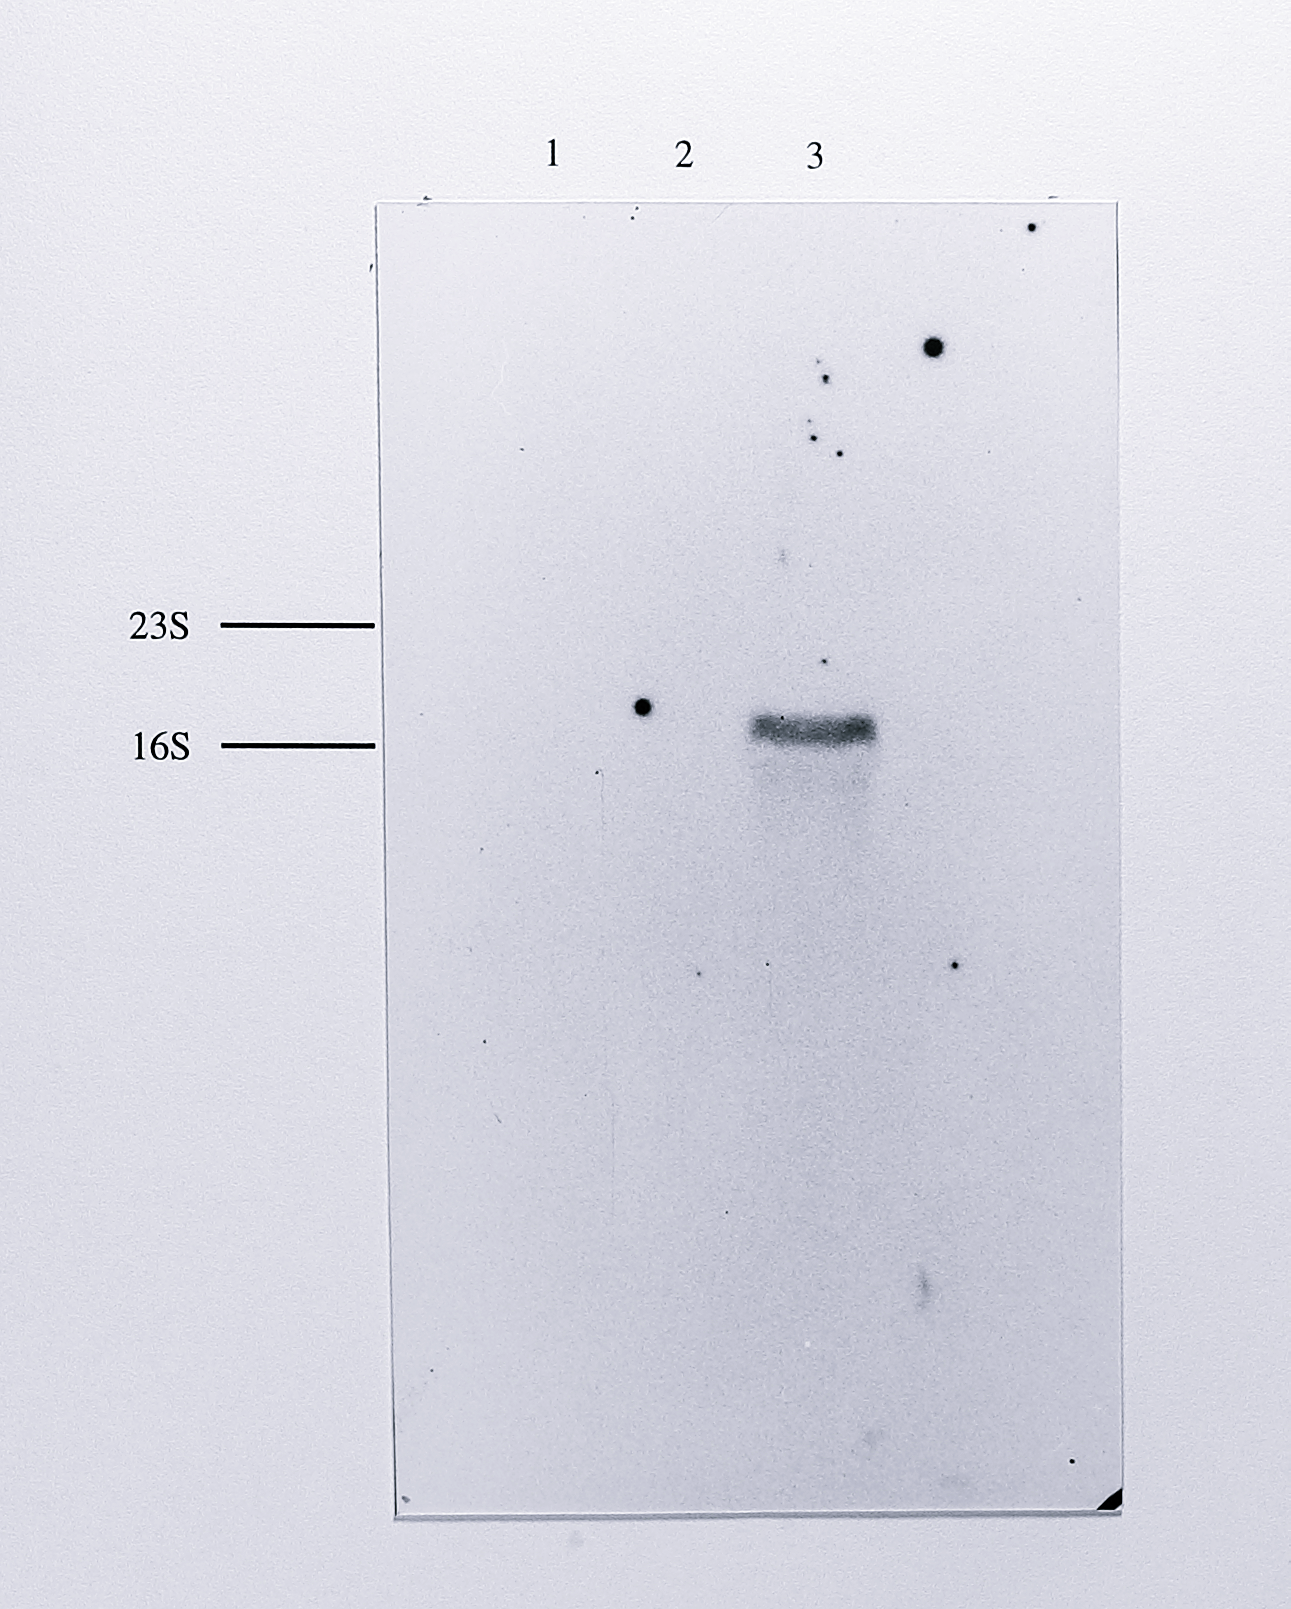
Figure 7.3: Northern blot of total RNA from anaerobically grown T. pantotropha, using a nirS-derived probe together with chemiluminescent detection. 10 \(\mu\)g of RNA from T. pantotropha grown anaerobically (lane 3) and aerobically (lane 2) and 10 \(\mu\)g of RNA from E. coli (lane 1) were separated by electrophoresis on a 1% agarose-formaldehyde gel, transferred to positive nylon and hybridised to a probe for the nirS gene as in Figure 7.2. The hybridised probe was detected using the chemiluminescent alkaline phosphatase substrate CSPD and the blot was exposed to X-ray film for 1 hour. A single band of approximate mobility 1.85 kb was detected in the lane containing RNA from anaerobically grown T. pantotropha. The very high stringency of the chemiluminescent detection protocol meant that no background was visible on the developed film; the outline of the original blot is the frame of the photograph. The relative positions of the 23S (2904 bases) and 16S (1541 bases) ribosomal RNAs species are shown at the left of the blot.
Northern blotting was also attempted using a 428 bp SphI DNA fragment containing the ends of the nirE (3’-end) and nirC (5’-end) genes as a probe, but no transcripts were detected in these experiments (results not shown).
A primer extension experiment was performed using a sample of T. pantotropha RNA in order to determine the transcription start point of the mRNA transcribed from the nirS gene. Three oligonucleotides were synthesised, designated 284R, 242R and 228R, that were homologous to the reverse strand of the early region of the nirS gene (Figure 7.4).
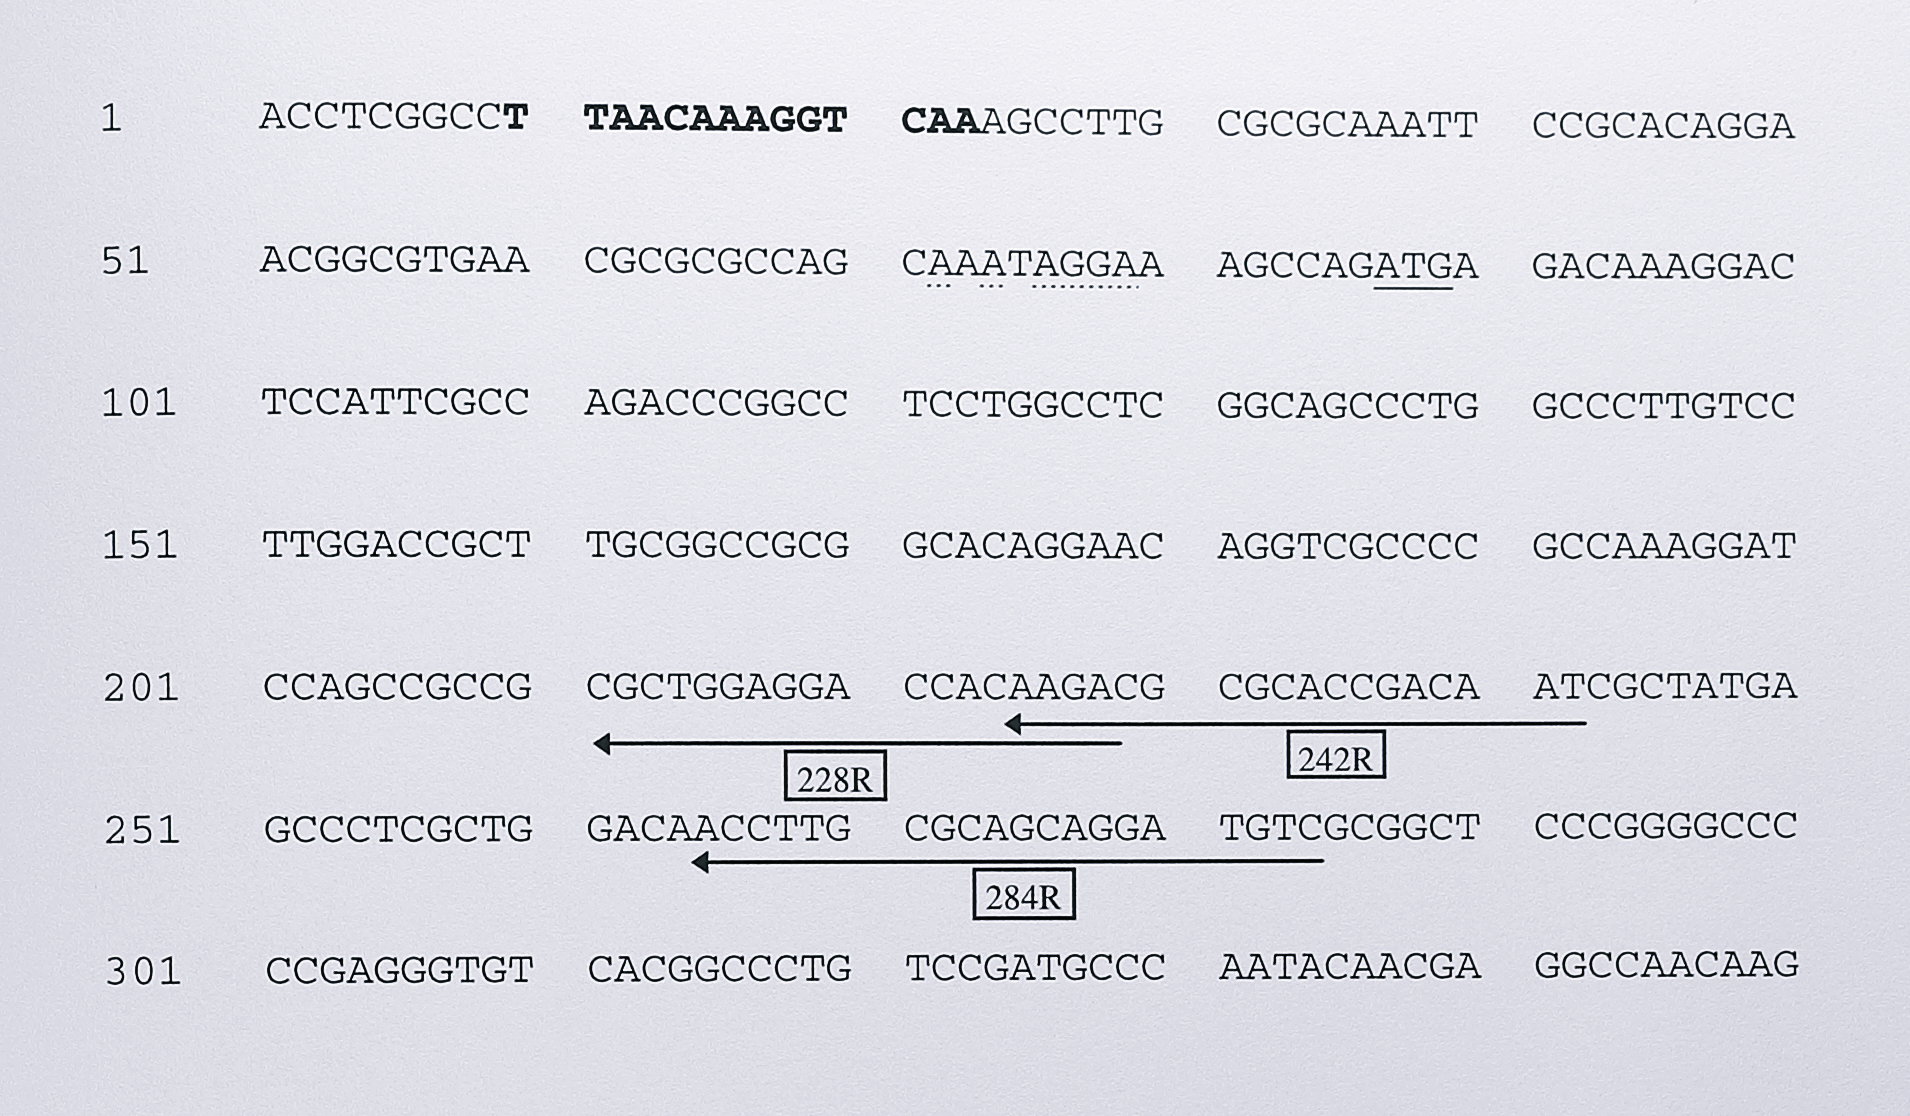
Figure 7.4: Location of primers used in primer extension and 5’-RACE experiments to determine the transcription start site of the T. pantotropha nirS gene. The upstream region of the nirS gene is shown, covering the putative promoter region and the first 88 codons of the nirS gene. The NNR box is in bold, the ATG start codon is underlined and a putative ribosome binding site is dash-underlined. The locations of the three reverse primers 284R, 242R and 228R are indicated by arrows.
The specificity of the oligonucleotides was analysed using PCR reactions with genomic DNA from T. pantotropha and the nirSF primer (Chapter 3, Table 3.1), which gave specific products of 197, 155 and 141 bp respectively (not shown). Early trials of the primer extension experiment indicated that the 228R primer was most specific for annealing to mRNA and so this primer was chosen for further work.
The 228R primer was labelled at the 5’-end with \(\gamma\)-\(^{32}\)P-ATP and approximately 10\(^5\) cpm of labelled primer was annealed to 40 \(\mu\)g of total RNA from T. pantotropha. Avian myeloblastosis virus (AMV) reverse transcriptase was then used to synthesise a cDNA extending from the labelled primer to the 5’-end of the nirS mRNA molecule (the 3’-end of the cDNA). The labelled cDNA was recovered by organic extraction and precipitation. It was then electrophoresed on a standard 6% acrylamide sequencing gel alongside a sequencing ladder generated using the 228R primer and the plasmid pTNIR3 (Chapter 4 Figure 4.2) as template DNA. The relevant portion of this gel is shown in Figure 7.5.
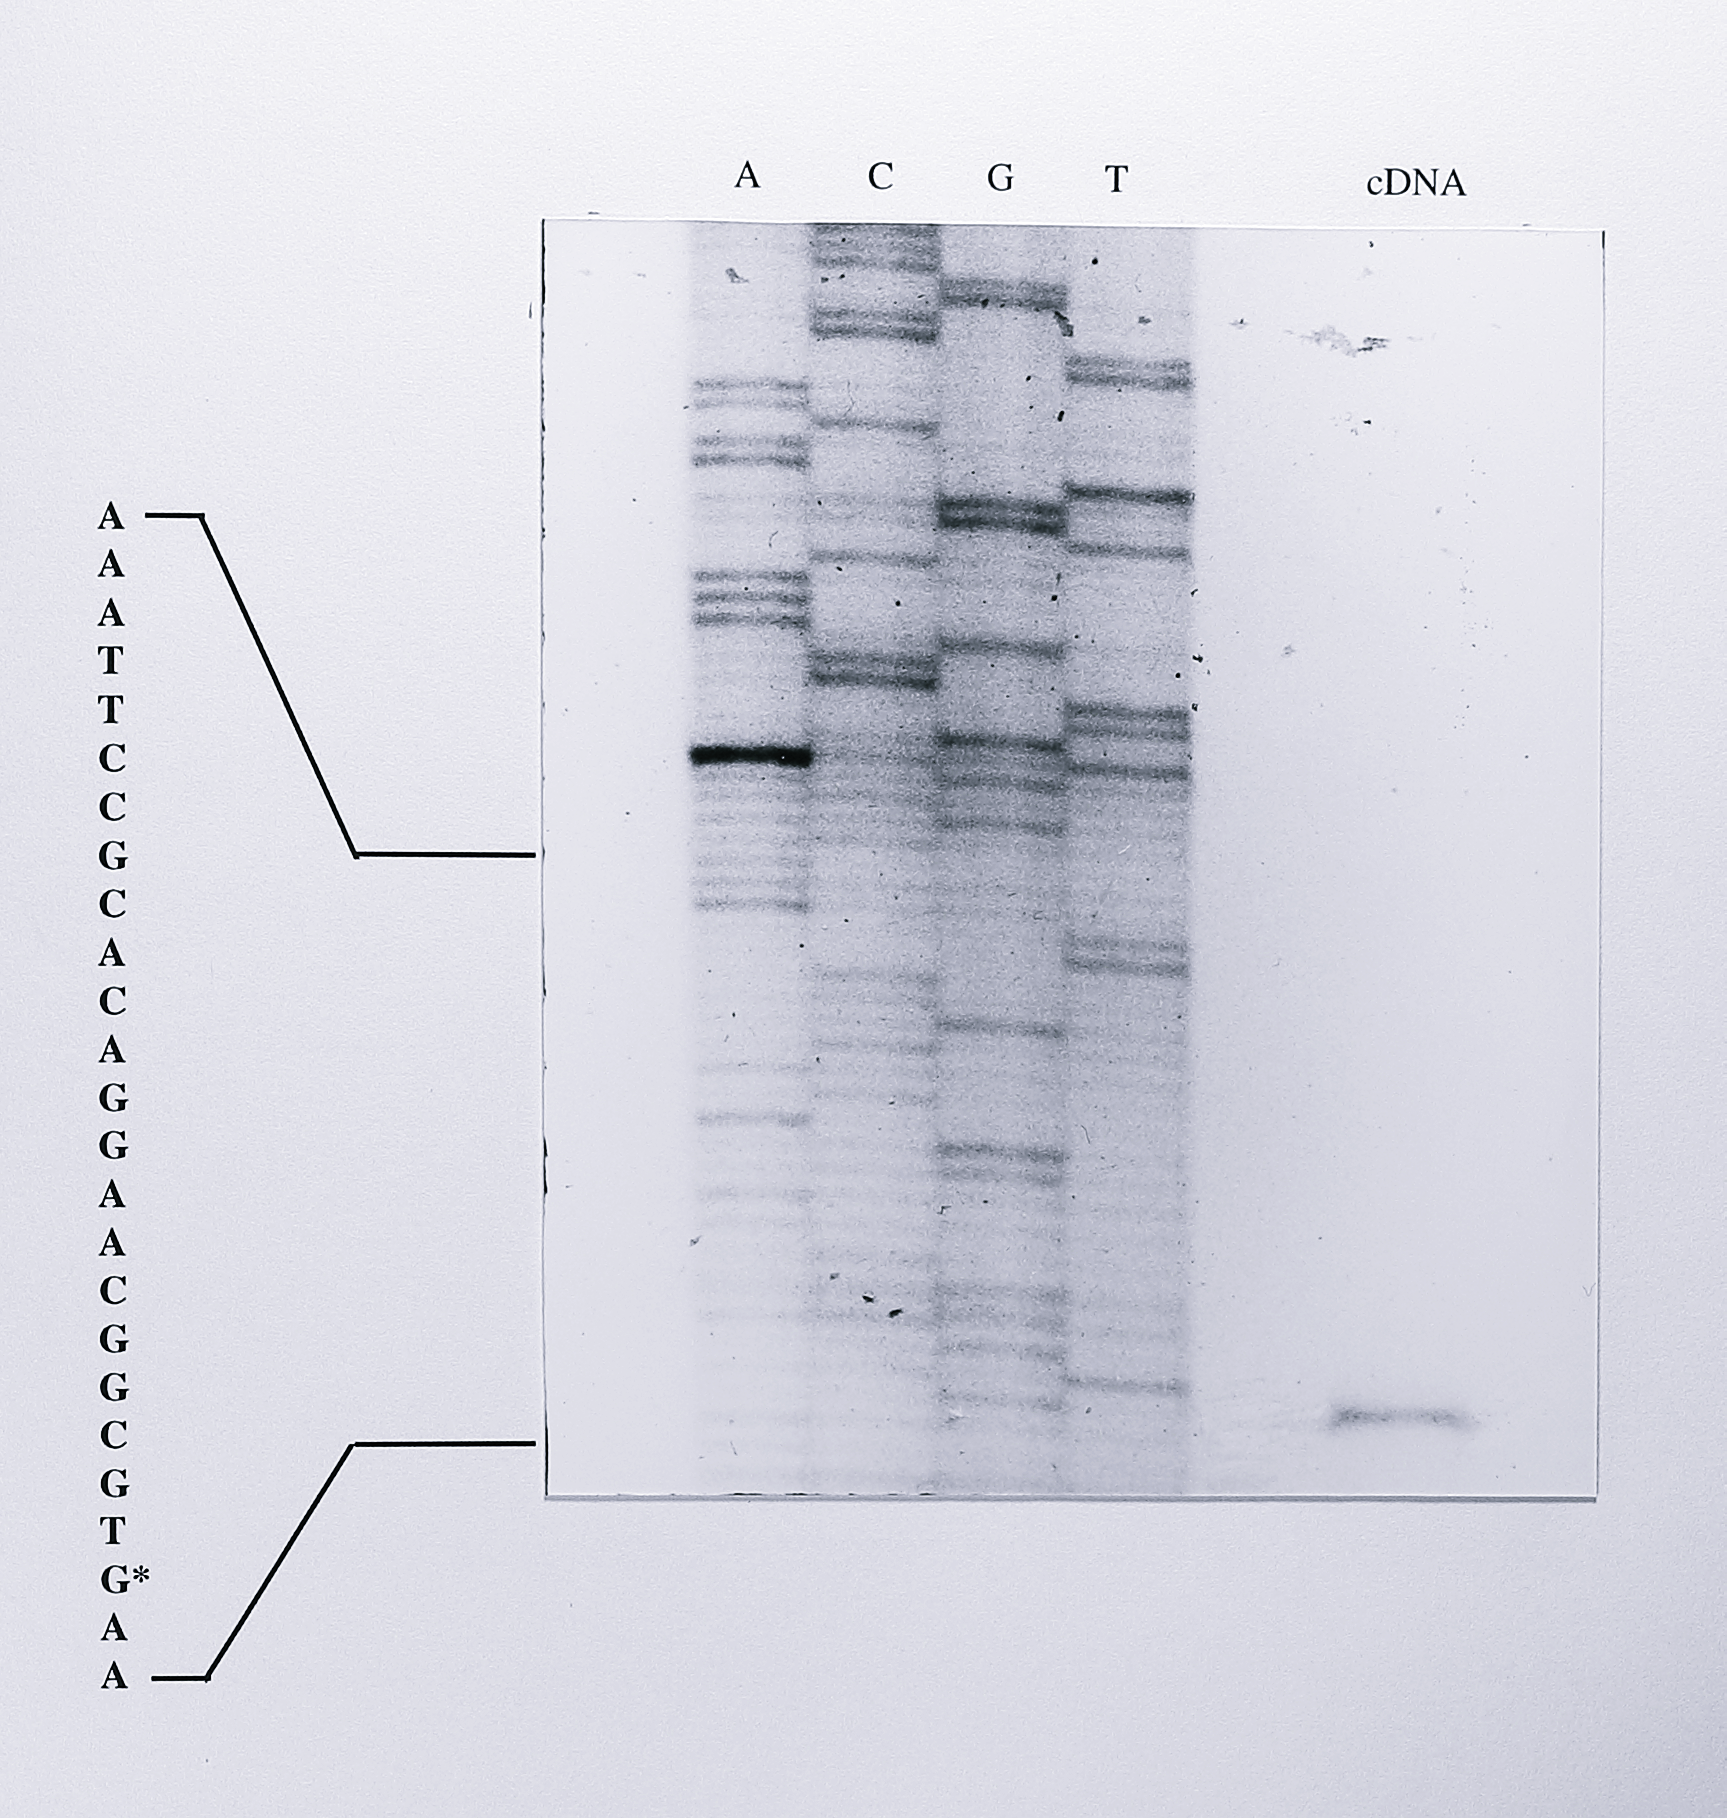
Figure 7.5: Primer extension product synthesised from nirS mRNA, compared with a sequencing ladder generated from the nirS gene using the same primer. 10 pmol of the primer 228R was labelled at the 5’-end using 50 \(\mu\)Ci of \(\gamma\)-\(^{32}\)P-ATP and approximately 10\(^5\) cpm of the labelled primer was annealed to 40 \(\mu\)g of total RNA from anaerobically-grown T. pantotropha. cDNA was extended from the labelled primer-template using 200 U of MMLV reverse transcriptase. The labelled cDNA product was precipitated redissolved and run on a 6% acrylamide sequencing gel alongside a sequencing ladder generated from the plasmid pTNIR3 (Chapter 4) and the 228R primer. Part of the sequence is shown at the left of the sequencing ladder and the G residue indicating the transcription start site with an asterisk. The sequencing ladder is not of high quality but as described in the text, previous knowledge of the nirS gene sequence and the results of the 5’-RACE experiment (Figure 7.10) allowed the transcription start site to be assigned unambiguously.
The sequencing reactions were not of high quality in this case and it was not possible to replicate the reactions before the activity of the labelled cDNA had reached unusable levels. However, it was clear that the labelled cDNA product ran with the same mobility as a guanine residue, 29 residues upstream of the nirS ATG start codon on the sequencing ladder. The NNR-binding site upstream of the nirS gene was also clearly visible on the sequencing gel and as the segment of DNA has been sequenced many times previously during sequencing of the nirS gene, it was possible to assign confidently a transcription start site for the nirS mRNA, as shown in Figure 7.6.
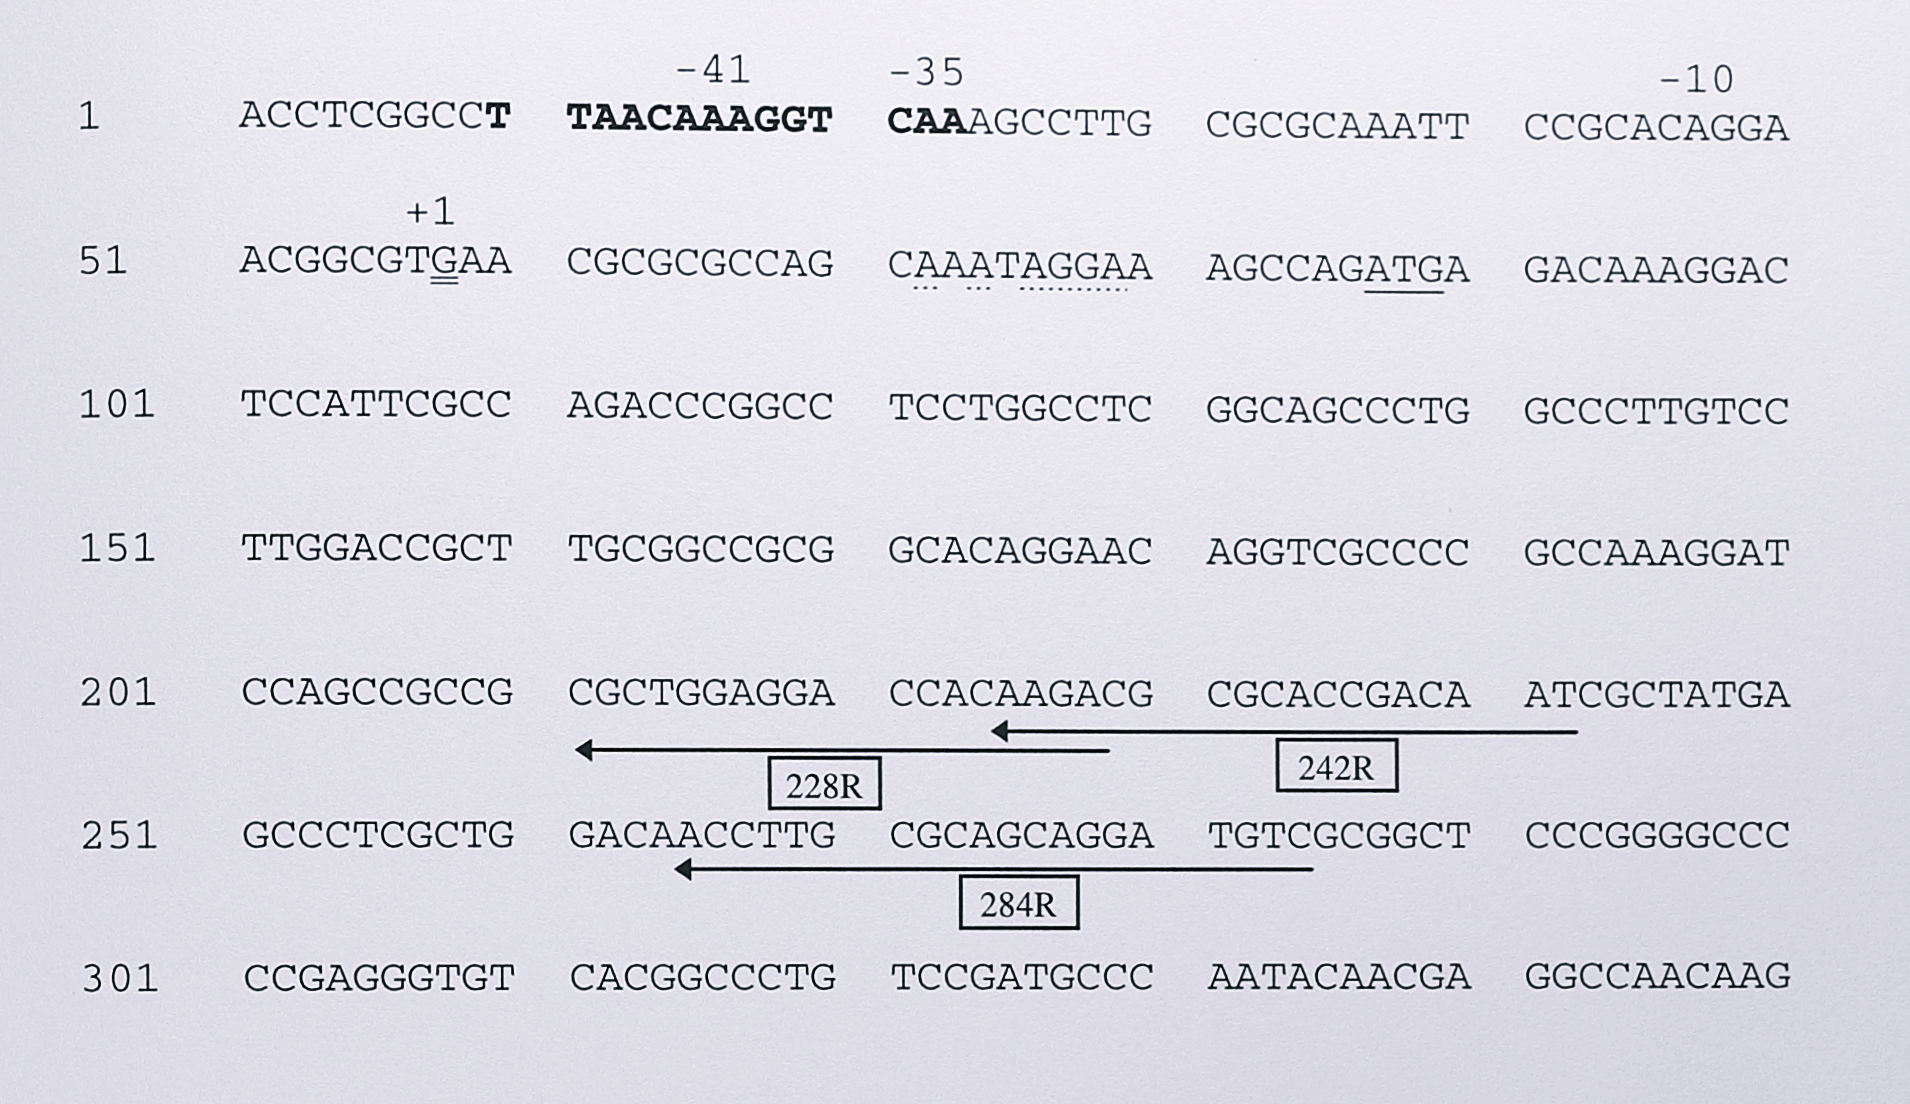
Figure 7.6: The upstream region of the T. pantotropha nirS gene, showing the transcription start site as determined using primer extension and 5’-RACE. The transcription start site is a G residue (double-underlined) 29 bp upstream of the ATG start codon (single-underlined). Other features are the putative ribosome binding site (dotted underlined) and the NNR box (bold). The reverse primers used in each experiment are shown by arrows. The bases 10, 35 and 41 bp upstream of the transcription start site are also indicated.
To confirm this result, the method of 5’-RACE [252] was employed to provide an independent estimate of the transcription start site. The basis of the method is outlined in Figure 7.7.
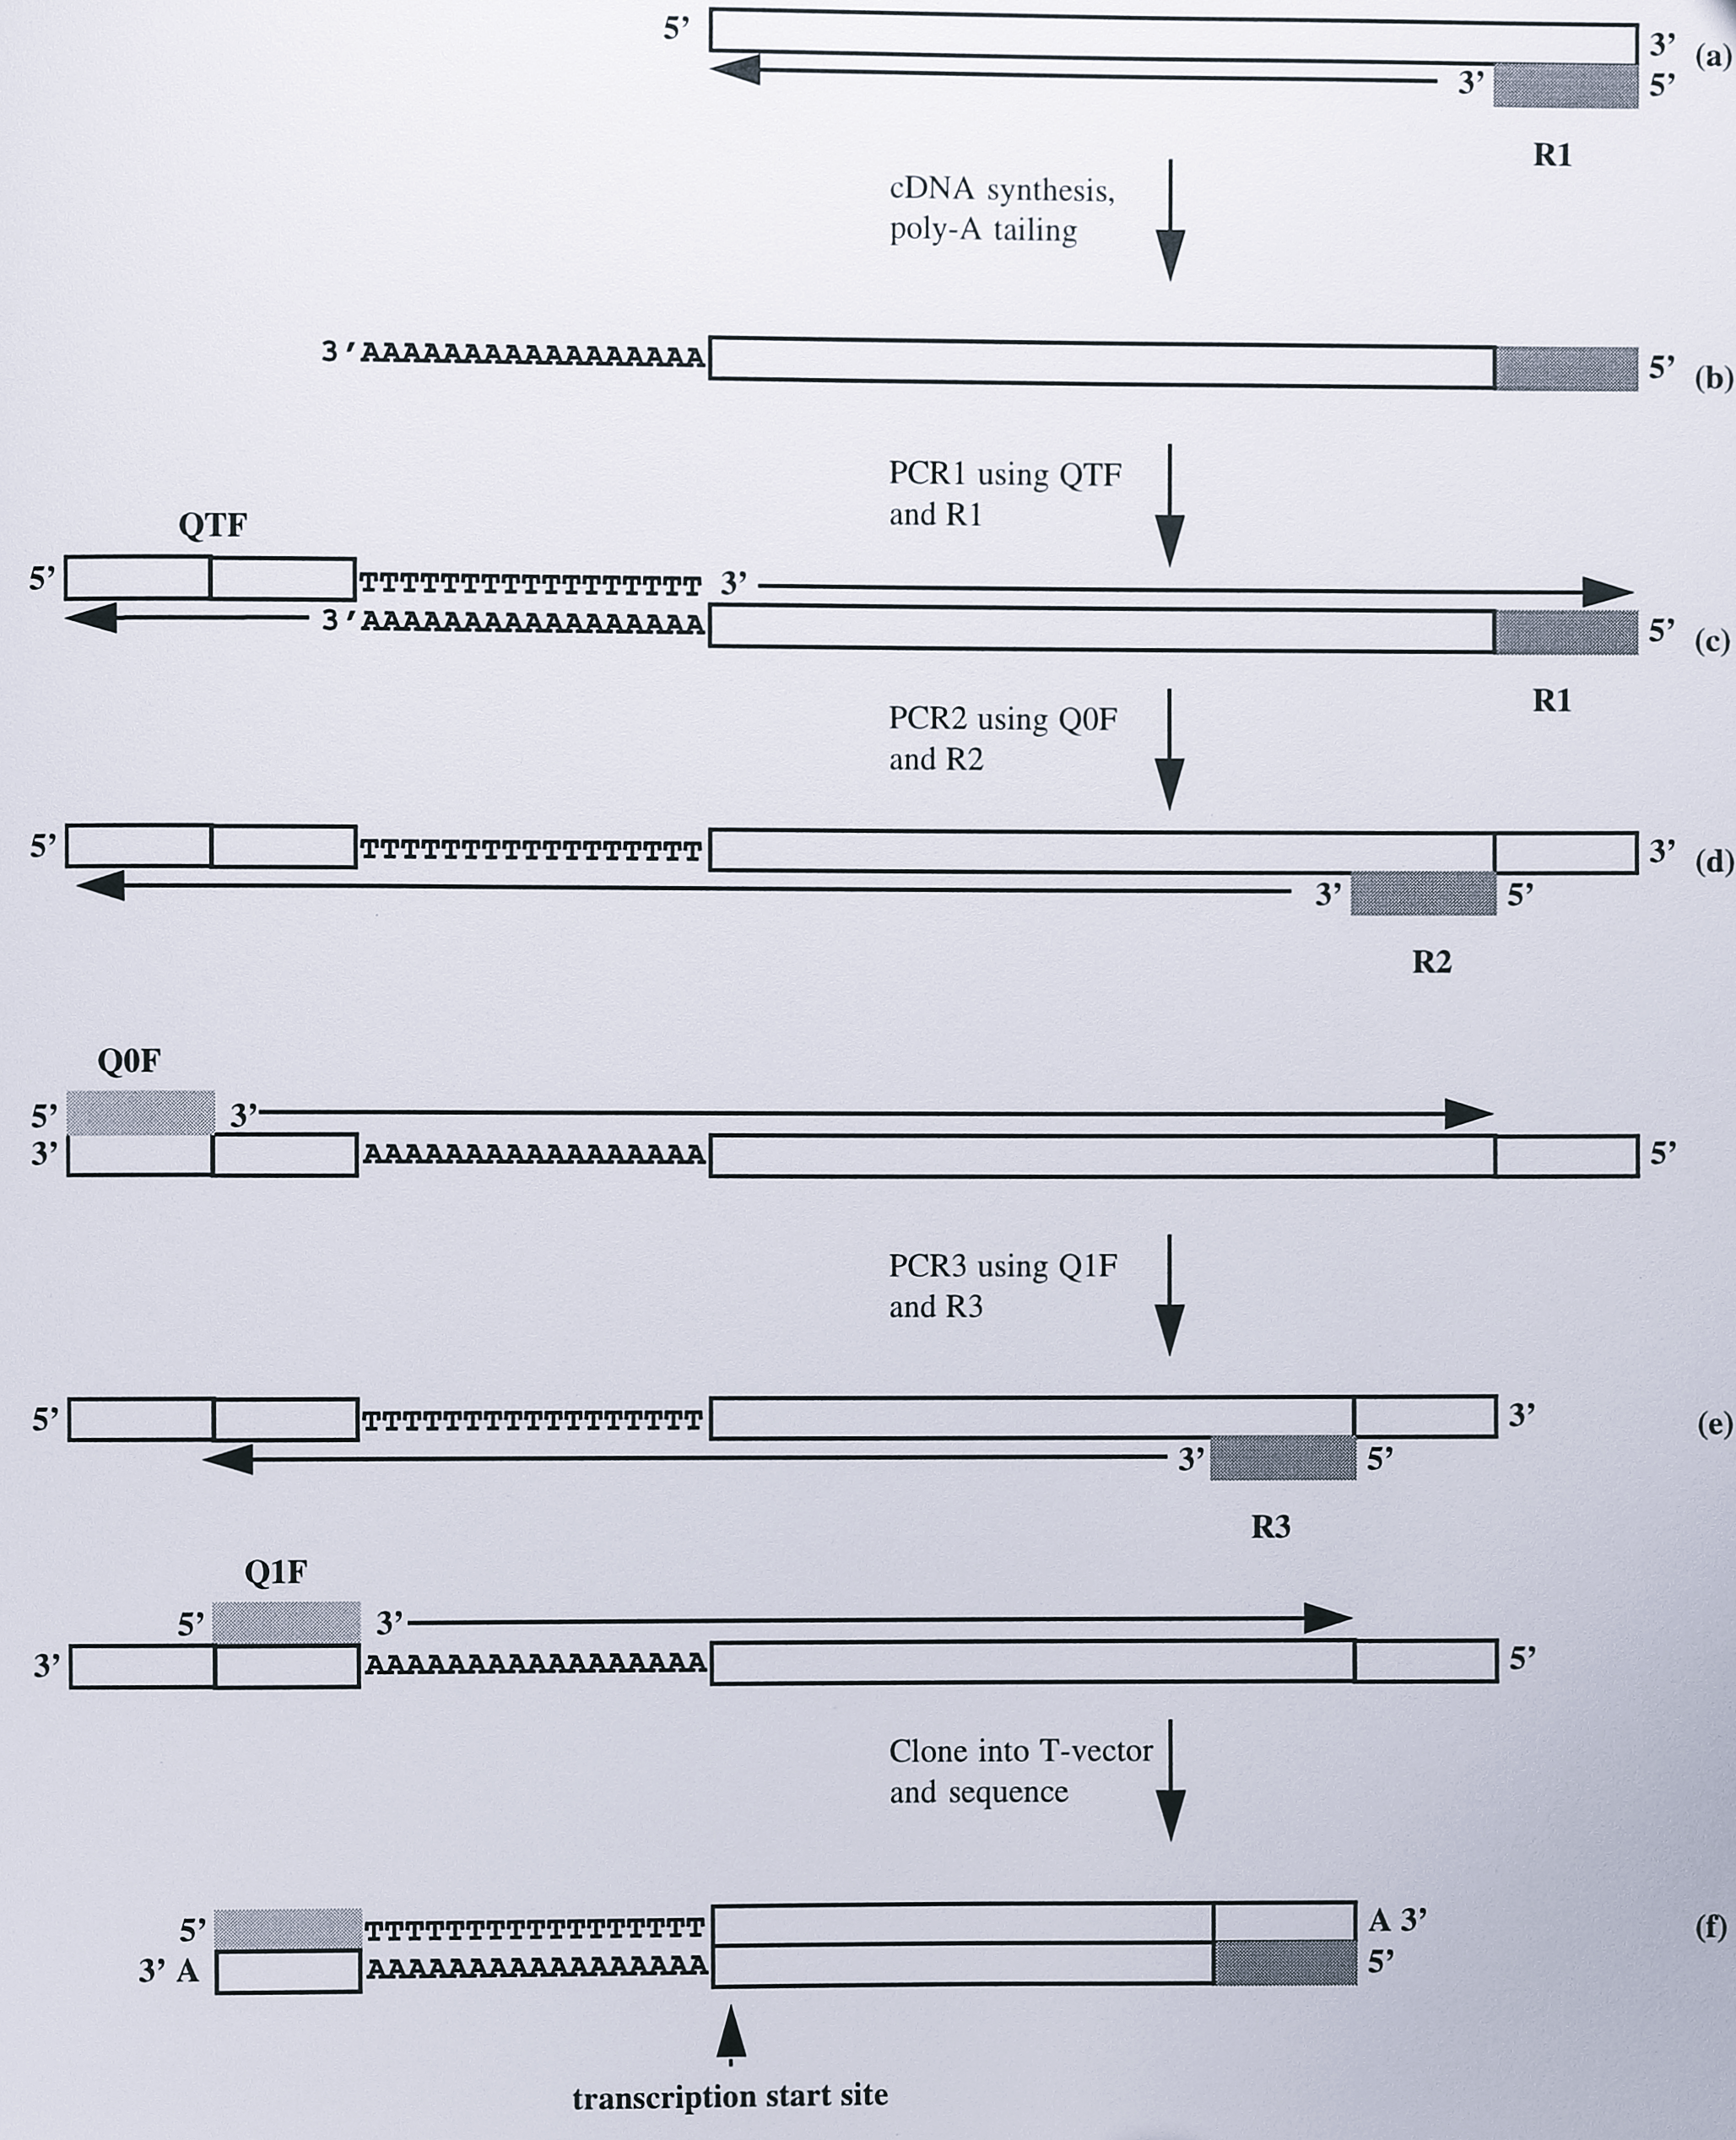
Figure 7.7: Schematic diagram illustrating the principle of the 5’-RACE method. (a) A reverse primer, R1, is used to synthesise a cDNA molecule from mRNA. The 3’-end of the cDNA is the complement of the transcription start site. (b) A poly-A tail is added to the 3’-end of the cDNA. (c) This allows several PCR cycles using the reverse primer R1 and the forward primer QTF, which contains a poly-T sequence and binding sites for two further forward primers Q0F and Q1F. (d) PCR is performed using the forward primer QOF and a second reverse primer R2. (e) final PCR reaction is performed using Q1F and a third reverse primer, R3, to increase specific (f) The final PCR product is cloned and sequenced; the transcription start site corresponds to the first base after the poly-A region.
As in the primer extension, experiment an oligonucleotide (R1) is first annealed to the specific mRNA and a cDNA is synthesised, the 3’-end of which corresponds to the 5’-end of the mRNA transcript. A tail of dATP residues is then added to the 3’-end of the cDNA using terminal deoxynucleotidyl transferase. This allows a set of nested PCR reactions to be performed, using three forward primers (QTF, QOF and Q1F [252]) and two further reverse primers, R2 and R3. The PCR product so generated can be cloned and sequenced conventionally and the 5’-end of the mRNA corresponds to the first residue seen after the poly-dATP tail on the sequencing ladder.
In the 5’-RACE experiment the primer 284R was annealed to nirS mRNA and extended using Moloney murine leukaemia virus (MMLV) reverse transcriptase to generate cDNA. Following initial PCR amplification using the QTF primer and 284R, nested PCR reactions were carried out using first QOF plus 242R and then Q1F plus 228R An aliquot of the last PCR reaction was electrophoresed on a 1.4% agarose gel (Figure 7.8).
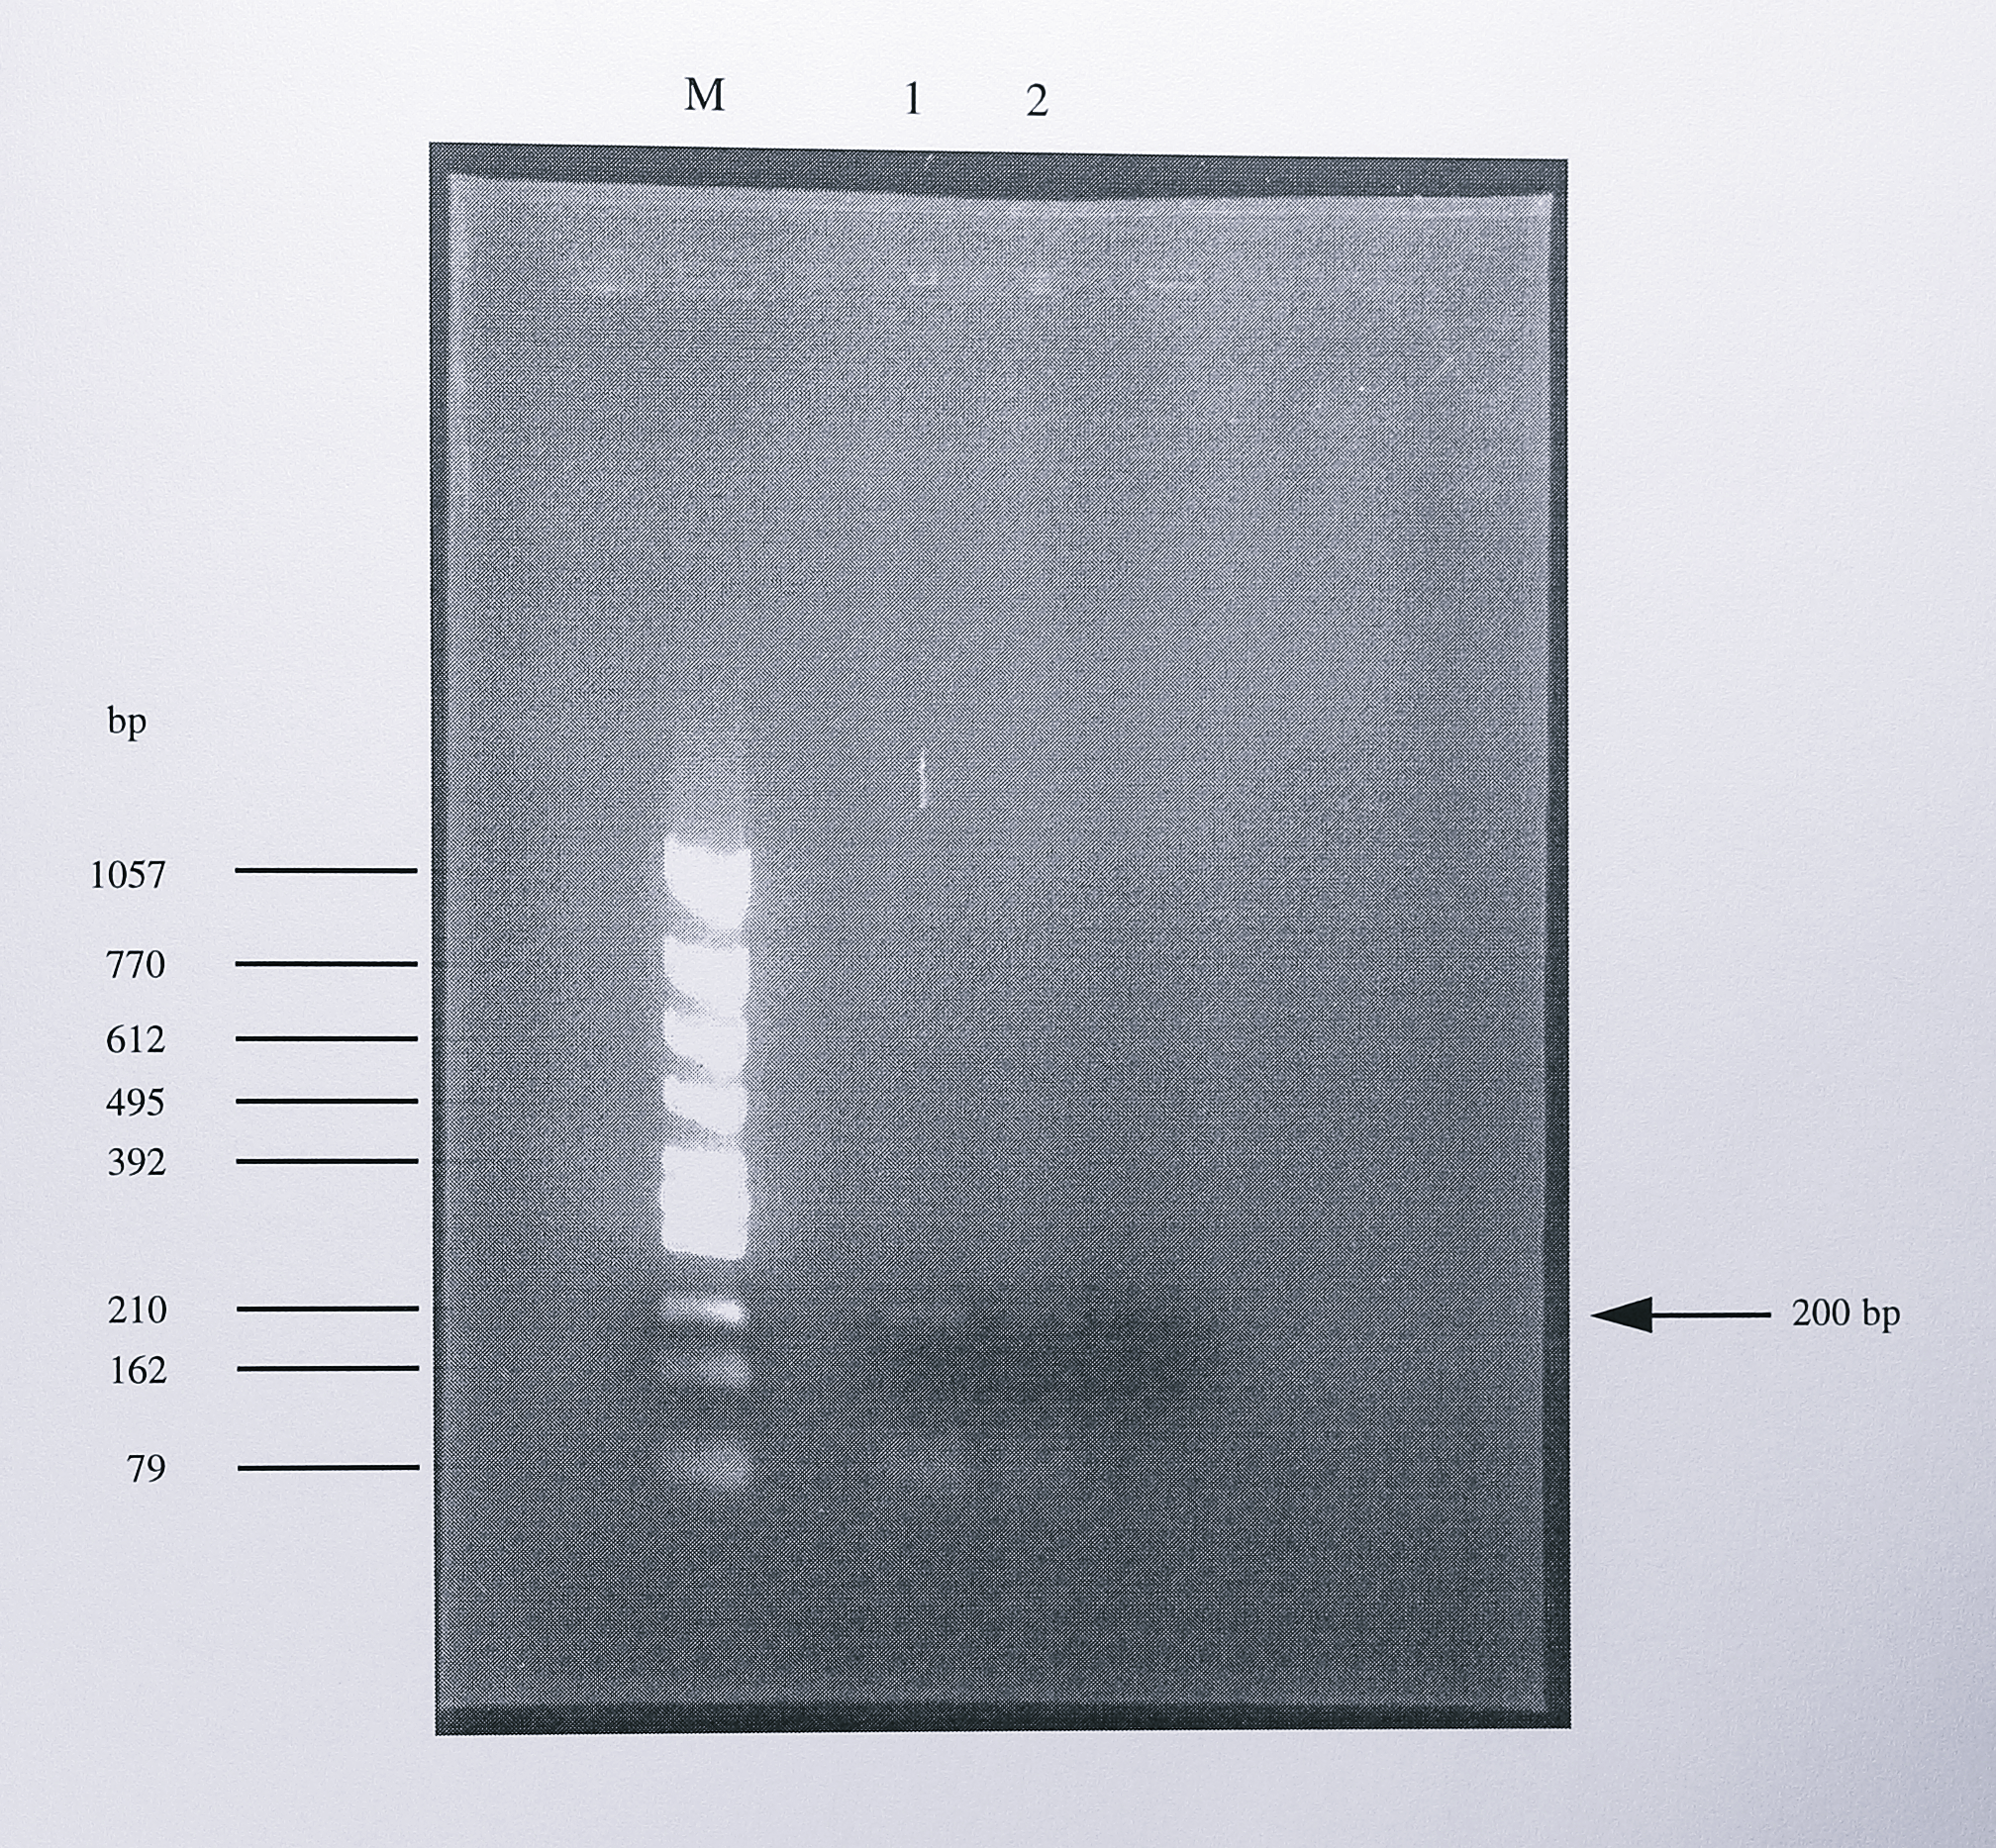
Figure 7.8: Analysis using agarose gel electrophoresis of the PCR product generated from nirS mRNA by 5’-RACE. Following cDNA synthesis using the primer 284R (Figure 7.4) and the addition of a poly-A tail to the cDNA product, three PCR reactions were performed using the primer pairs QTF + 284R, QOF + 242R and Q1F + 228R (see Figure 7.7). 10 \(\mu\)l of the final PCR reaction were separated by electrophoresis on a 1.2% agarose gel. Lanes 1 and 2 show a single PCR product of approximately 200 bp in length. To optimise the PCR reaction different conditions were used in the last PCR reaction; lane 1 used a high-salt buffer and lane 2 used low-salt buffer. The lane labelled M contains DNA size standards, the sizes of some of which are indicated at the left of the gel.
After optimisation of the PCR reactions, a single PCR product of approximately 200 bp was present in the sample. The PCR product was purified from the gel and ligated into plasmid pGEM-T. The presence of the insert was confirmed, following blue-white selection, by digestion using the restriction enzymes SphI and NdeI (Figure 7.9).
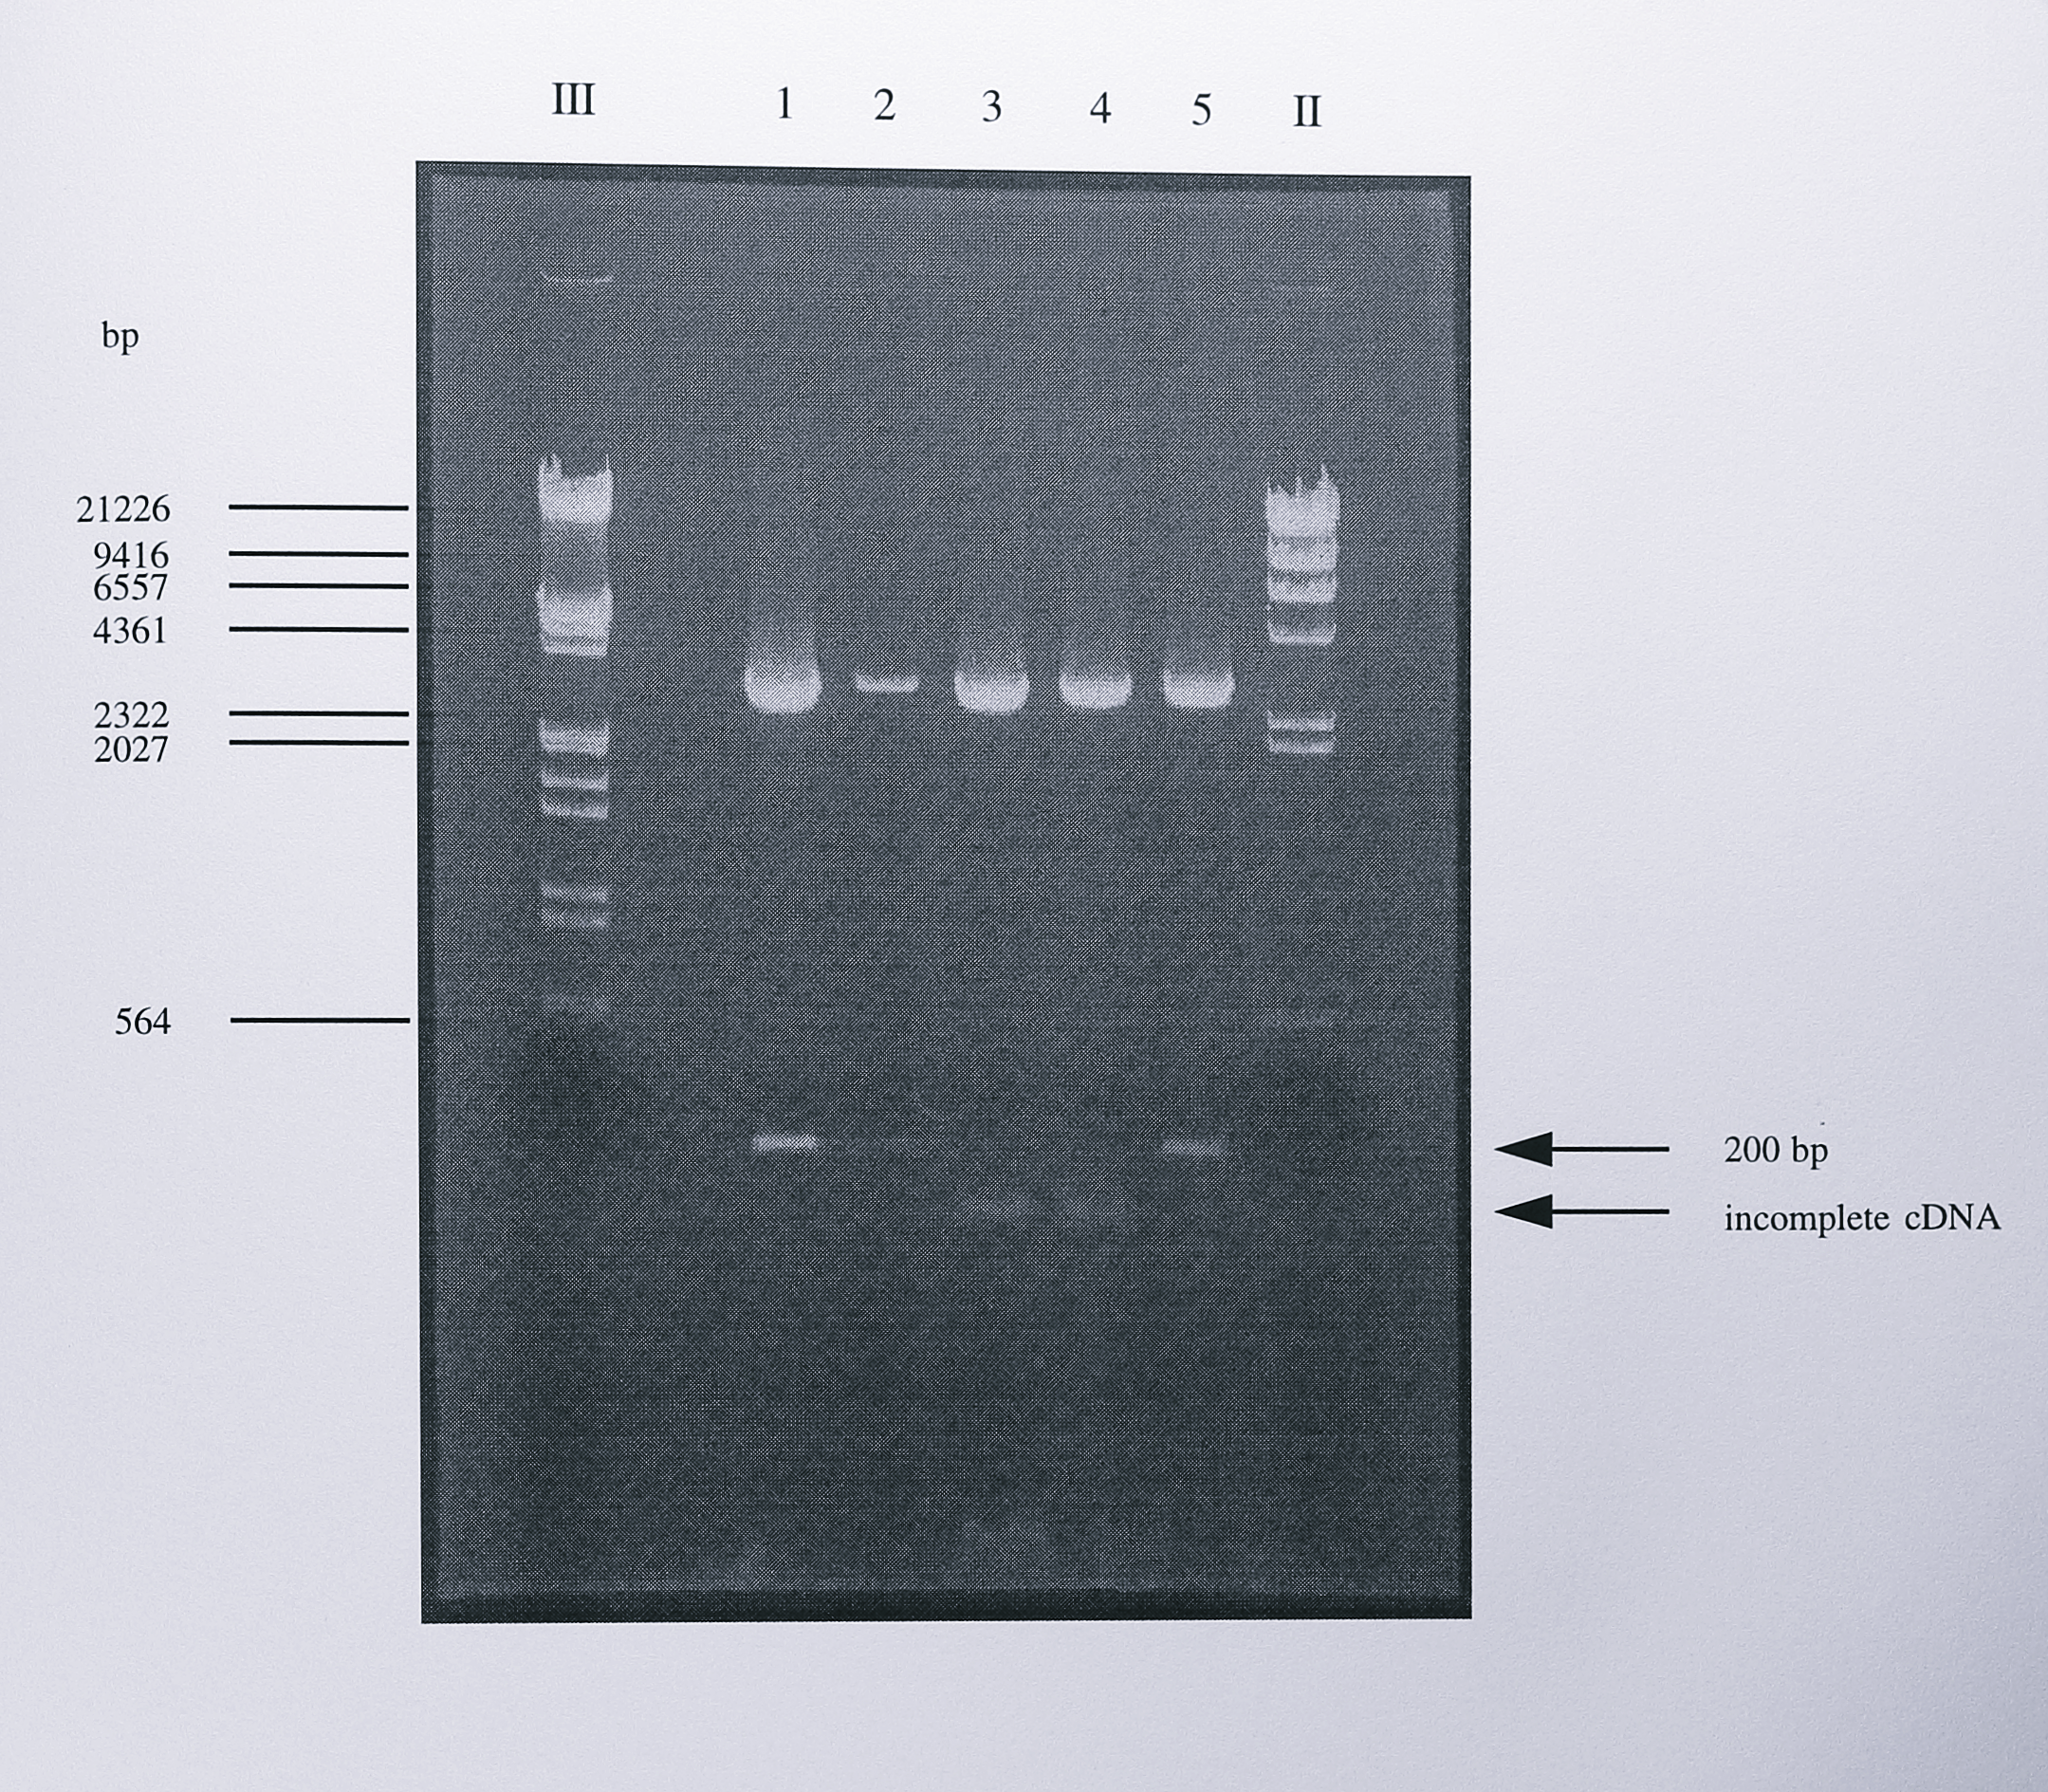
Figure 7.9: Restriction digest analysis of the cloned PCR products generated from nirS mRNA by 5’-RACE. The 200 bp PCR product generated by PCR using the primers Q1F and 284R (Figure 7.8) was cloned into the T-vector pGEM-T. Following blue-white selection, positive clones were digested using the enzymes SphI and NdeI. These enzymes cut once each side of the multiple cloning site but not in the nirS gene sequence and therefore were a good screen for the presence of a cloned insert. Three of the clones (lanes 1, 2 and 5) contained the expected 200 bp insert. the other clones (lanes 3 and 4) contained a smaller insert. Sequencing of the latter clones showed that the smaller insert originated in the coding region of the nirS gene and therefore resulted for incomplete cDNA synthesis during 5’-RACE. The lanes labelled III and II contained DNA size standards, some of which are indicated to of the gel.
The digests revealed that some of the clones contained a smaller insert than expected. Digestion of the plasmids using BamHI produced a single linear fragment of 3.2 kbp, consistent with the presence of a single BamHI site in the early region of the nirS gene (not shown). One of each of the plasmids containing the larger and smaller inserts was sequenced using the M13 universal forward and reverse primers. The sequencing ladder generated from the plasmid containing the larger insert is shown in Figure 7.10.
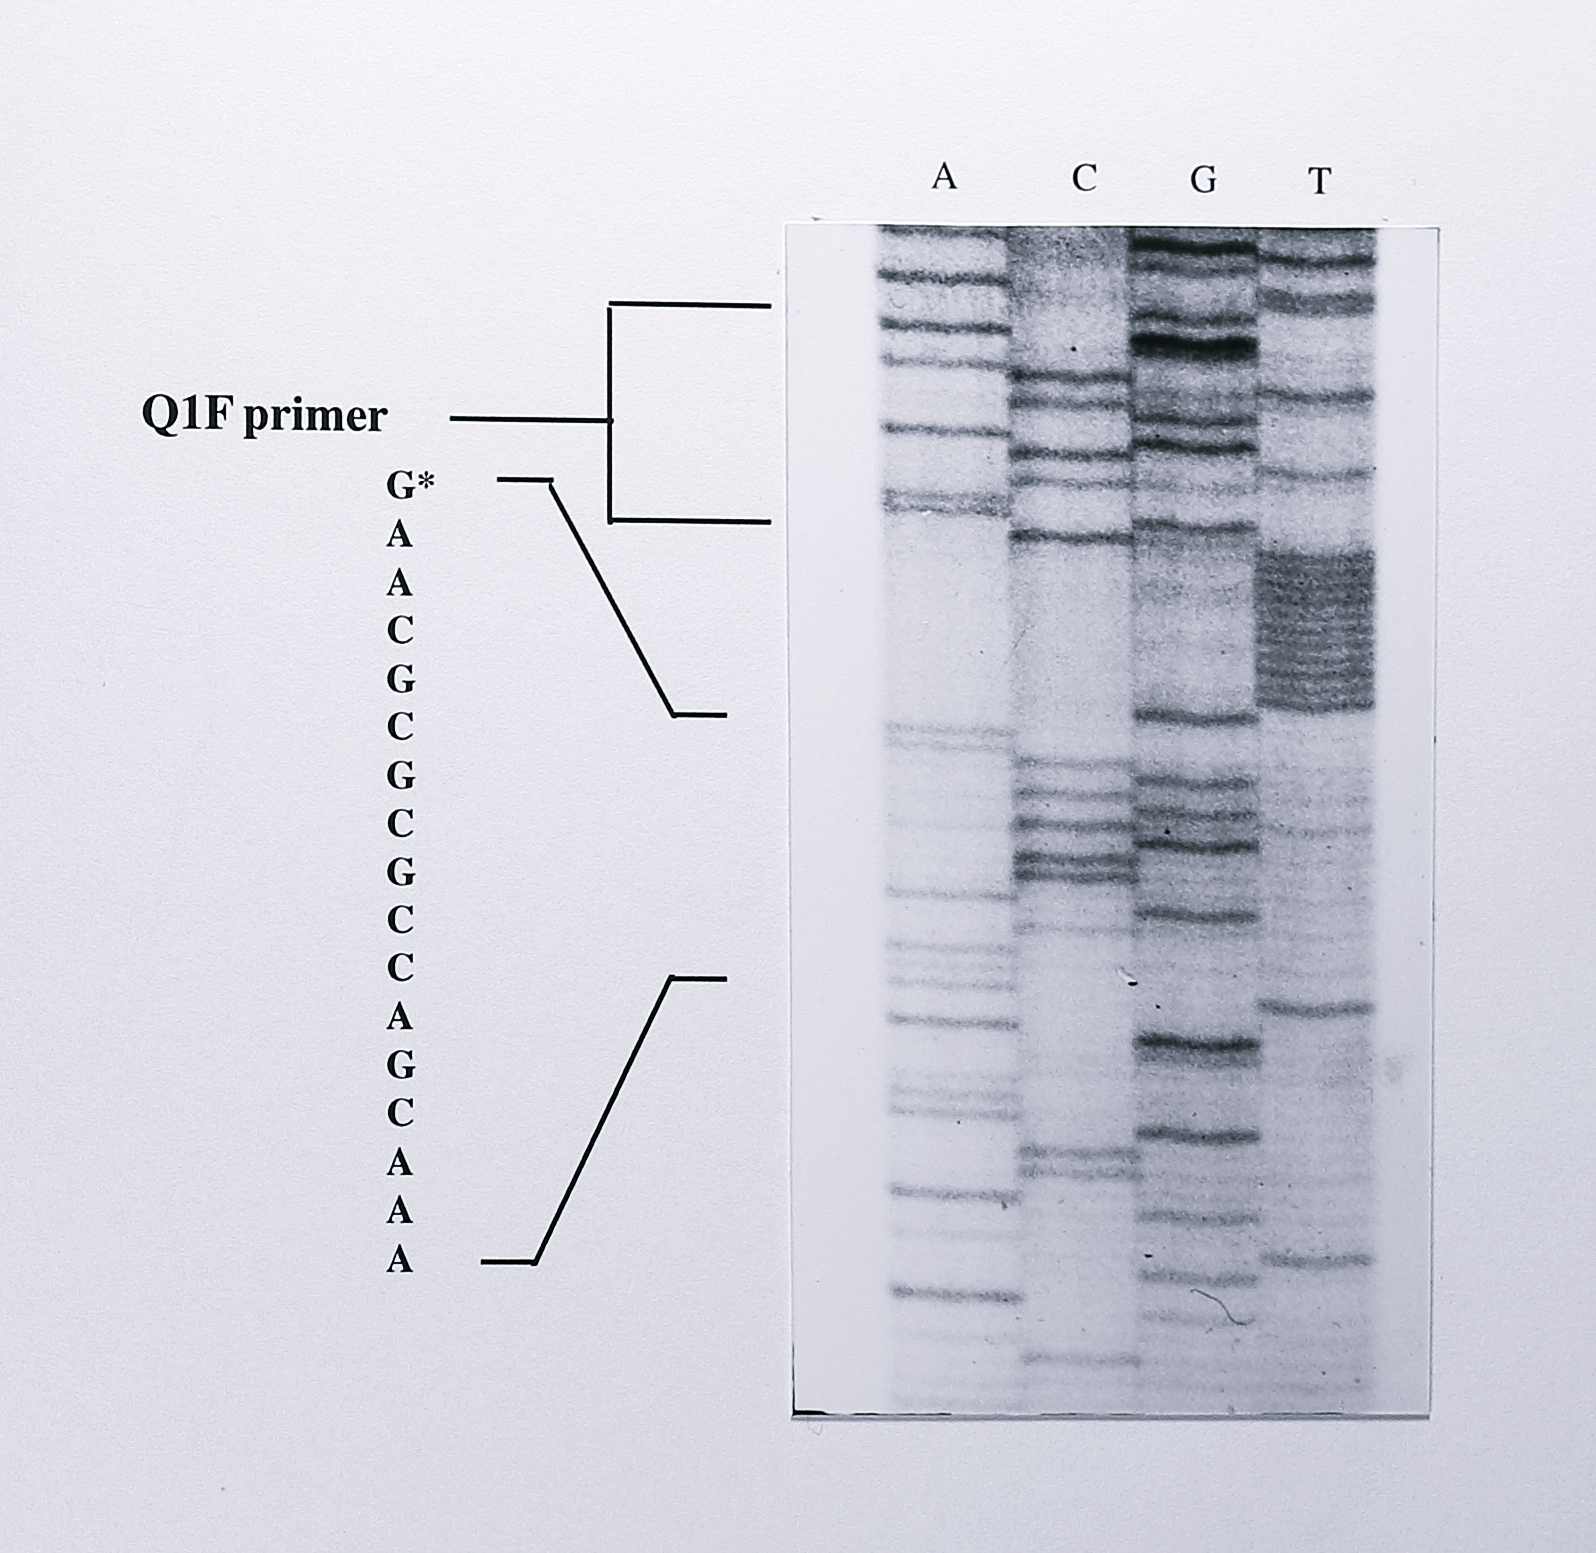
Figure 7.10: Sequence of the cloned PCR product synthesised from nirS mRNA by 5’-RACE. The PCR product generated using the primers Q1F and 228R (see text for details) was cloned into the vector pGEM-T (Figure 7.9) and sequenced using the M13F universal primer. The Q1F primer can be read from the sequence and is followed by 11 T residues, representing the poly-A tail that was added to the cDNA following its synthesis from the nirS mRNA. The residue immediately following the poly-T sequence is a G residue (asterisked). This residue indicates the 5’-end of the mRNA and is the same residue as that identified by primer extension.
The Q1F primer sequence and poly-dATP tail were clearly visible. Following the poly-dATP tail was a guanine residue and comparison to the sequence of the nirS gene showed that this was the same guanine residue detected by the primer extension experiment. Sequence from the plasmid containing the smaller insert started within the coding region of the nirS gene, indicating that the cDNA generated in this case was truncated and had not reached the 5’-end of the transcript.
7.3 Discussion
Isolation of prokaryotic RNA can be technically challenging due to the short half-life of bacterial mRNA (typically 1-2 minutes [329]) and the problem of contamination with both endogenous and exogenous RNases. The quality of isolated RNA is determined by two main measurements: a ratio of absorbances at 260 and 280 nm of 1.7 2.0 and a 23S:16S rRNA intensity ratio of 2:1 when stained with ethidium bromide after denaturing gel electrophoresis. Total RNA isolated from T. pantotropha contained two major bands that stained with ethidium bromide in a 2:1 ratio, but comparison with RNA from E. coli showed that the 23S rRNA band was largely absent in these samples, having apparently degraded to a 16S rRNA sized species and a smaller species. However this is not indicative of general degradation in the RNA samples. Specific degradation of the 23S RNA molecule has been observed during RNA isolation from the bacterium Rhodobacter capsulatus [330], an organism that is very closely related to T. pantotropha. In the latter case it was demonstrated that intact 23S rRNA could be isolated using sucrose density gradient centrifugation and the conditions of gel electrophoresis (in particular a low concentration of divalent cations) were responsible for the observed degradation. Fragmentation of the 23S rRNA molecule has also been observed in Rhodospirillum rubrum [331], Rhodobacter sphaeroides [332] and Agrobacterium tumefaciens [333]. In the latter case degradation of the 23S rRNA is proposed to occur in vivo during maturation of the ribosome. Thus it is clear that 23S rRNA degradation is common to several members of the \(\alpha\)-Proteobacteria, including species that are closely related to T. pantotropha. The positive results of the experiments described in this chapter also show that the nirS mRNA that was isolated cannot have been severely degraded.
Northern blotting using a DNA probe for the nirS gene identified a single transcript that was approximately 1.85 kb long. The coding region of the nirS gene is 1788 bp long and in P. denitrificans PD1222 is followed by the genes nirE (864 bp), nirC (309 bp), nirF (1155 bp) and nirD (645 bp) [141]. Preliminary sequencing and restriction analysis of the nir locus in T. pantotropha indicates the presence of at least nirE and nirC. The 1.85 kb mRNA species is therefore a nirS transcript. Knowledge of the nirS gene transcription start site described later in this chapter allows an approximate placement of the end of the nirS transcript between the nirS and nirE genes (Figure 7.11).
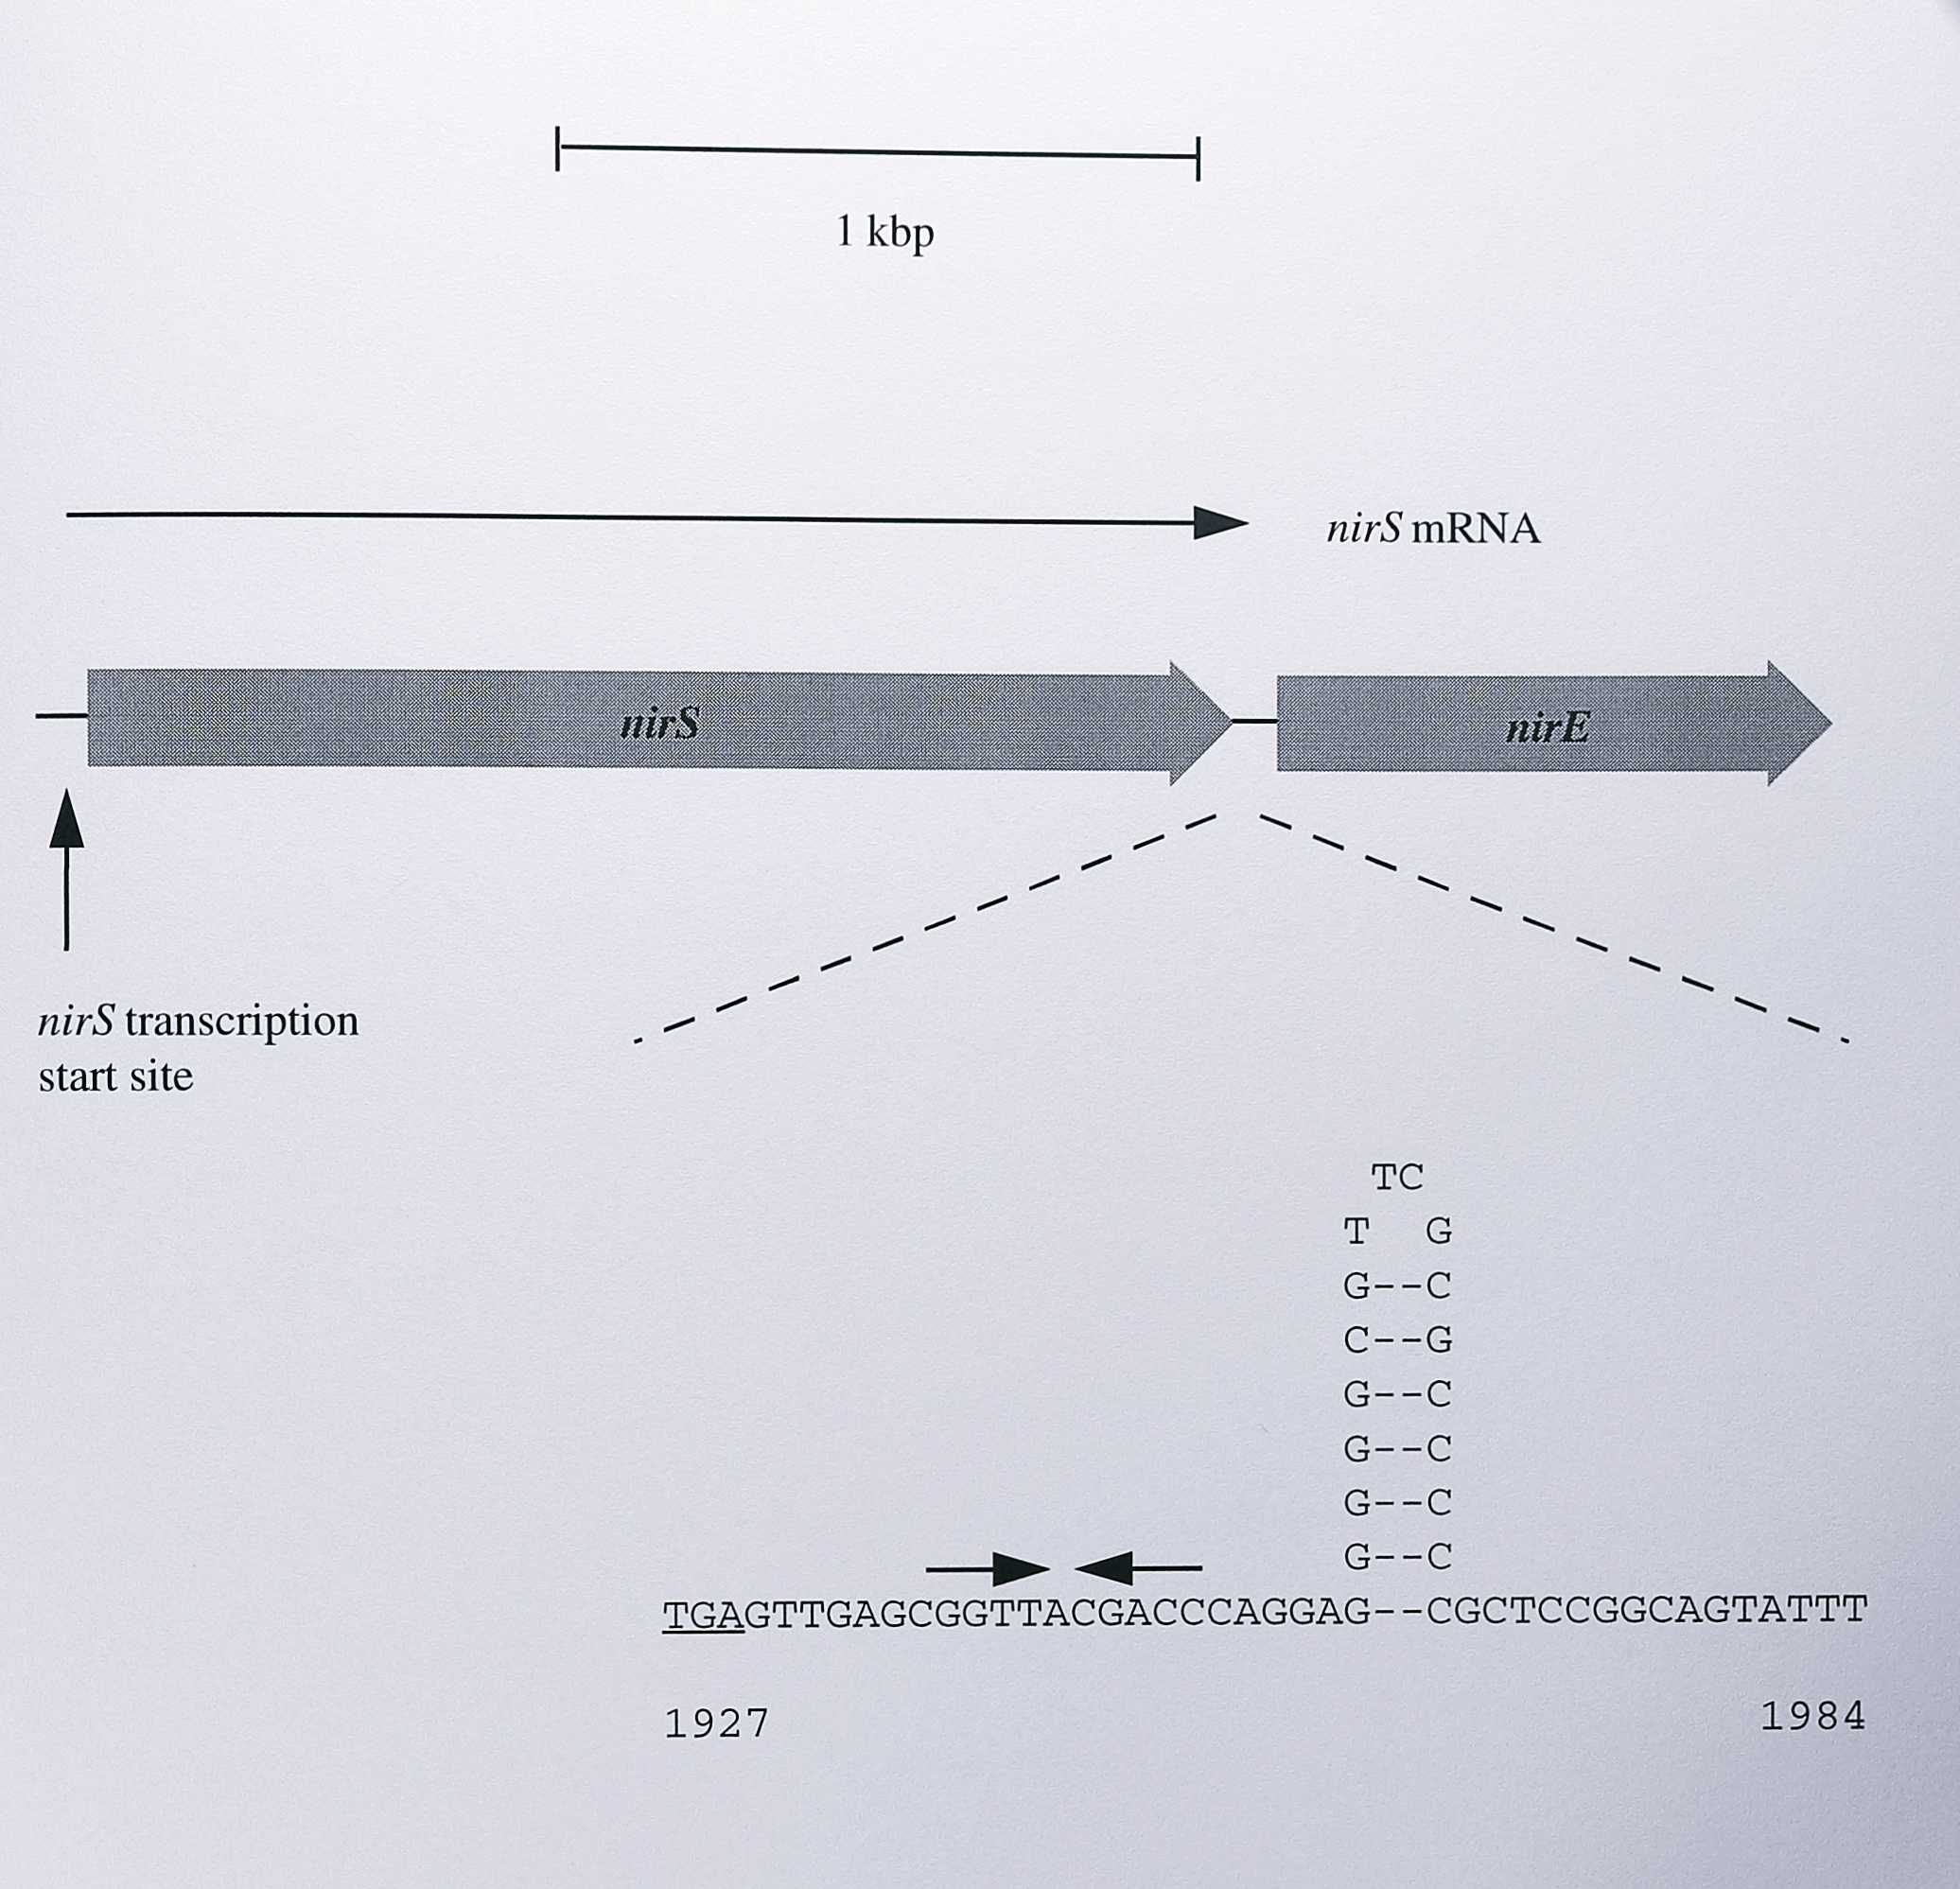
Figure 7.11: Model for transcriptional termination of the T. pantotropha nirS gene. The length of the nirS mRNA is estimated at 1.85 kb by Northern blotting (Figure 7.2). Alignment of the mRNA with the nirS and nirE genes places the end of the mRNA between the two genes, just before a strong inverted repeat. The TGA stop codon of the nirS gene is underlined. The repeat could form a stem-loop structure as shown in the diagram and is followed by a relatively AT-rich region. This feature strongly resembles rho-dependent terminators in other genes. A second inverted repeat of unknown function before the putative terminator is indicated by inward-facing arrows. The intergenic sequence is numbered according to the sequence presented in Chapter 3.
An imperfect inverted repeat 18 bp long (described in Chapter 3) lies between these two genes This feature was originally annotated as an oxygen responsive element in the P. denitrificans PD1222 nir locus, but it bears little resemblance to other ORE features and the annotation has subsequently been withdrawn [141]. It seems more likely that the inverted repeat is involved in terminating the transcription of the nirS gene. The GC-rich region can form a stem-loop structure as shown in Figure 7.11 and together with an AT-rich region downstream of the repeat, the structure is very similar to a rho-independent termination site [334].
Transcription of the nir region in T. pantotropha thus appears to differ from that of the nir genes in Ps. stutzeri Zobell and Ps. aeruginosa. In Ps. stutzeri Zobell two transcripts containing either nirS or nirS plus nirT have been detected [222], whilst in Ps. aeruginosa no transcript analysis has been performed to date, although analysis of the nir region suggests a large single transcript containing the genes nirSMCFDLGHJEN terminated by a stem-loop structure [323]. Chemiluminescent detection of the nirS gene probe using a high-stringency protocol that is at least as sensitive as \(^{32}\)P-based methods [251] failed to detect any longer transcripts from T. pantotropha in the present work. However, it is still possible that longer transcripts including the nirS gene are present in vivo; they may be present at only very low levels or, alternatively, very large transcripts may not be efficiently transferred to the nylon membrane prior to hybridisation. Transfer of large mRNA molecules can be improved by partial hydrolysis prior to blotting [237] and it would be of interest to repeat the experiment using this technique. Northern blotting was attempted using a labelled DNA probe derived from parts of the nirE and nirC gene but no transcript was detected. It may be that the transcript containing these genes was not detectable for the reasons described above. Alternatively the probe may not have been of sufficient quality; although the nirS gene probe efficiently detected the nirS transcript, single-stranded RNA probes are preferred for Northern blotting [335]. In future experiments it would be valuable to synthesise riboprobes from the nir genes for Northern blotting.
The transcription start site of the nirS gene was identified as a guanine residue 29 bp upstream of the nirS ATG start codon. The sequencing ladder used in the primer extension experiment was not of high quality, but as described in the results section assignment of the start site was possible with prior knowledge of the nirS gene sequence in the relevant region. Additionally, the independent method of 5’-RACE gave the same result for the start site. The guanine residue is a good candidate for the authentic transcription start site as mRNA transcripts most often begin with a G or an A residue [336] and the start site is -41.5 bp downstream of the centre of the NNR box. The spacing is the same as that observed between the FNR-binding site and the transcription start site in E. coli genes that are activated by FNR [337]. Once the transcription start site of the nirS gene had been identified it was possible to look for upstream sequence features that might be involved in transcriptional regulation. The first observation is that there are no sequences which resemble the -10 and -35 hexamers seen upstream of sigma-70 dependent genes from other species of bacteria, particularly E. coli. In E. coli these regions are well characterised and consist of the consensus sequence TTGACA-N\(_{16-18}\)-TATAAT, where the TTGACA sequence is centred at -35 and the TATAAT sequence (or Pribnow box) is centred at -10 from the transcription start site [336]. The -35 and -10 sequences are involved in binding the \(\sigma^{70}\) subunit of the RNA polymerase holoenzyme [338]. There is evidence that T. pantotropha probably does contain a \(\sigma^{70}\) dependent RNA polymerase; a recent survey of genes from P. denitrificans and other \(\alpha\)-Proteobacteria in which the transcription start site is known has shown that a similar \(\sigma^{70}\) consensus sequence can be discerned in some instances [339]. Additionally, the gene xylE cloned in a broad host range vector under the control of the \(\sigma^{70}\)-dependent bacteriophage T4 gene 32 promoter was transcribed from an identical start site in a range of Gram-negative bacteria, including Paracoccus denitrificans [340], suggesting a common mechanism of \(\sigma^{70}\) recognition. In the case of the nirS gene it might be expected that the RNA polymerase binding sites differ from those normally found in \(\sigma^{70}\) dependent genes as the NNR-binding site overlays the -35 region and the NNR protein contains a putative site for interaction with RNA polymerase [169]. However, due to the lack of an obvious -10 site in the nirS gene it is concluded that transcription of the nirS gene is probably independent of \(\sigma^{70}\). A less likely possibility is that the specificity of the T. pantotropha \(\sigma^{70}\) subunit differs from that of the E. coli \(\sigma^{70}\) and can bind to a much weaker -10 consensus, particularly when binding is enhanced by the NNR protein. Experiments in Ps. aeruginosa using the ANR and FNR proteins indicated that the Ps. aeruginosa \(\sigma^{70}\)- dependent RNA polymerase may have different specificity from that of the E. coli enzyme [205] and in vitro data also suggested that the purified polymerase may be less stringent [341].
An alternative -10/-35 promoter consensus sequence was proposed by Steinrücke and Ludwig (1993) [259], based on the analysis of several genes from P. denitrificans and closely- related species. This consensus was TTCGGN-N\(_{16-20}\)-GATNGG/C. A match to this, with four of the six positions filled in each hexamer can be discerned in the nirS upstream sequence if it is assumed that as in E. coli the -10 site is allowed to fall anywhere in the first hexamer. However, this consensus is now thought unlikely to be accurate as very little of the data was based on experimentally determined transcription start sites for P. denitrificans genes. Furthermore, genes that encoded proteins from a range of metabolic activities were included in the analysis, with little consideration of whether the genes were expressed constitutively or under specific conditions.
The last point is very important as in order to analyse the transcription of the nirS gene in a meaningful manner, it should really be compared with the transcription of other NNR-dependent (or possibly FNR-dependent) genes from P. denitrificans or its close relatives. Unfortunately no information concerning transcripts from the nir or nor genes in P. denitrificans is available apart from that reported in this chapter, as most work in the area has been carried out using Ps. stutzeri Zobell. However, it was possible to examine the sequences of the NNR-dependent genes nirS and norCB from P. denitrificans and T. pantotropha by aligning the NNR-binding sites of these sequences and looking for common features lying between the NNR-binding site and the ATG start codon (Figure 7.12).
![Alignments of the upstream regions of NNR-regulated genes from _P. denitrificans_ and _T. pantotropha_ showing regions of conserved sequence. Group 1 shows genes with the consensus hexamer TTGCGC in the upstream region. The _nirI_ gene is assumed to be regulated by NNR (see text for details). Also included are the non-NNR-regulated genes _nirE_ and _nnr_. Group 2 shows a consensus resembling the RpoN binding site in the _nirI_ and _nnr_ upstream regions. The NNR binding site is shown in bold, the ATG start codon is in bold-italic. In Group 1 the TTGCGC hexamer is underlined, in Group 2 residues matching the RpoN consensus are underlined. +1 indicates the transcription start site of the _nirS_ gene. A perfect 10 bp inverted repeat in the _nirS_ gene is indicated by inward-facing arrows. Sequence data for _P. denitrificans_ PD1222 and _P. denitrificans_ 12442 was taken from GenBank accession number U05002 and Ohshima et. al. (1993) [@ohshima_cloning_1993], respectively.](figure/fig7-12.png)
Figure 7.12: Alignments of the upstream regions of NNR-regulated genes from P. denitrificans and T. pantotropha showing regions of conserved sequence. Group 1 shows genes with the consensus hexamer TTGCGC in the upstream region. The nirI gene is assumed to be regulated by NNR (see text for details). Also included are the non-NNR-regulated genes nirE and nnr. Group 2 shows a consensus resembling the RpoN binding site in the nirI and nnr upstream regions. The NNR binding site is shown in bold, the ATG start codon is in bold-italic. In Group 1 the TTGCGC hexamer is underlined, in Group 2 residues matching the RpoN consensus are underlined. +1 indicates the transcription start site of the nirS gene. A perfect 10 bp inverted repeat in the nirS gene is indicated by inward-facing arrows. Sequence data for P. denitrificans PD1222 and P. denitrificans 12442 was taken from GenBank accession number U05002 and Ohshima et. al. (1993) [140], respectively.
The nirI genes from these organisms were also included in this analysis as they may be regulated by NNR (see below). Several regions of homology between some or all of the sequences are apparent from this alignment. First, the nirS genes contain a perfect inverted repeat of 10 bp which begins five base pairs after the last nucleotide of the NNR-binding site. These repeats were noted during the sequencing of the nirS gene described in Chapter 3. Less well-defined repeats can be discerned in some of the other sequences, but the repeats in the nirS sequences stand out because they are perfect and because of a striking structural conservation; the first and last dinucleotides in the repeat from the T. pantotropha sequence are TT and AA respectively whereas those in the two sequences from the P. denitrificans nirS genes are GG and CC. Thus although the sequences differ, a perfect repeat is conserved in each case. This feature suggests a structural role for the repeat. A possible role is in the binding of a transcriptional repressor protein which would serve to prevent transcription of the nirS gene under non-denitrifying conditions. Repeats of similar size and structure that serve to bind repressors are common to many prokaryotic genes [342].
The second striking feature in the upstream sequences is the presence of a hexanucleotide with the sequence TTGCGC in the nirI and two of the nirS sequences. sequence (TTGCCG) and in two sequences that are apparently not regulated by NNR: nirE Similar sequences are seen in the T. pantotropha nirS gene sequence (TTCCGC), the norCB (TTCGCG) and the nnr gene itself (TTGCGC). In the case of the T. pantotropha nirS gene the hexanucleotide is centred at -16.5 relative to the transcription start site. This sequence lies in a similar position relative to the NNR box in all of the NNR-regulated genes and the conservation in terms of sequence and position strongly suggests a role for this region of sequence. Closer examination of the region that includes the TTGCGC hexanucleotide reveals some similarity to a family of promoters that are dependent on an alternative sigma factor, designated variously as \(\sigma^{54}\), NtrA or RpoN. RpoN-dependent promoters were first identified in genes involved in nitrogen fixation [343] and have since been identified in several organisms where they regulate a diverse range of functions [344]. RpoN differs from the better-known \(\sigma^{70}\)-dependent RNA polymerase in that it requires an ATP-binding activator protein in order to initiate transcription from an open promoter-polymerase complex [345]. Additionally, the consensus sequence that is recognised by RpoN differs from the -35/-10 \(\sigma^{70}\) sequences found in E. coli (Figure 7.12). The minimum requirement for an RpoN-dependent promoter is a GC dinucleotide found 11-14 base pairs upstream of the transcription start site (most often found at the -12 position) and an invariant GG dinucleotide 10 bp further upstream. most often at the -24 position [346]. In Figure 7.12 it can be seen that the regions upstream of nirI and nnr contain these dinucleotides with the correct spacing relative to each other and some additional sequence conservation at other residues. However, the nirS, nirE and norCB genes lack one of the guanine residues in the invariant GG dinucleotide. Additionally, the GC dinucleotide begins at the -17 position in the nirS genes which is rather far from the more normal -12 position.
It therefore seems unlikely that the sigma factor involved in transcription of the denitrification genes is the RpoN protein. However, it is still plausible that a similar type of protein might be involved. Putative RpoN binding sites have been identified in the upstream regions of some genes involved in denitrification, including the Ps. stutzeri Zobell nosZ gene [347] and the nnrR gene of R. sphaeroides 2.43 [204]. The effects on denitrification of knocking out the rpon gene in these organisms have yet to be investigated, although it is known that disruption of the rpoN gene in Ps. aeruginosa has no effect on denitrification [348]. In contrast, disruption of the rpoN (formerly hno) gene in Alcaligenes eutrophus exerts a wide-ranging pleiotropic effect including the loss of denitrification [349]. Although rpoN disruption in Ps. aeruginosa had no effect on denitrification, it is known that there are promoters in this organism which resemble RpoN-dependent promoters, in that they possess the GG-N\(_{10}\)-GC motif but the GC dinucleotide is upstream of the normal -12 position and the genes are fully functional in the absence of RpoN. Intriguingly, one such gene is that which encodes the FNR homologue ANR in Ps. aeruginosa [350] and it has been suggested that these “RpoN-like” promoter regions depend on an alternative sigma factor. In Bradyrhizobium japonicum, an organism quite closely related to T. pantotropha there are two rpoN genes encoding the proteins RpoN, and RpoN2, with distinct specificities [351]. It is tempting to speculate that this is also the case in T. pantotropha and P. denitrificans and that one of the RpoN homologues would be involved in denitrification.
Whatever the identity of the sigma factor involved in transcription of denitrifying genes, a model for its interaction with the promoter and with other regulatory components would be extremely valuable. At present genes encoding four types of regulatory protein have been identified in the denitrification gene clusters of the principal denitrifying organisms. The properties of these proteins are summarised in Table 7.1.
| Regulatory protein | Cellular location and putative features | Comments and references |
|---|---|---|
| FnrP | Cytoplasmic. N-terminal iron-sulphur cluster, RNA polymerase contact site, dimerisation domain, helix-turn-helix DNA-binding motif. | P. denitrificans homologue of the E. coli FNR protein. Regulates transcription of membrane-bound nitrate reductase, cytochrome c peroxidase and cbb\(_3\)-type cytochrome c oxidase (van Spanning et al. 1997) [195]. |
| Nnr | Cytoplasmic. Similar to FnrP, but lacks N-terminal cysteine residues involved in binding iron-sulphur cluster. | Homologue of FNR, specifically regulates transcription of nitrite and nitric oxide reductases (van Spanning et al. 1995) [197]. |
| NosR | Membrane-bound. Iron-sulphur cluster. Helix-turn-helix DNA-binding motif. | Identified in P. denitrificans but not characterised (Hoeren et al. 1993) [96]. Homologue in Ps. stutzeri regulates transcription of nitrous oxide reductase (Cuypers et al. 1992) [173]. |
| NirI | Membrane-bound. Iron-sulphur cluster. Less clear helix-turn-helix DNA-binding motif than NosR. | Homologue of NosR, but not well characterised. Regulates transcription of nitrite reductase (de Boer et al. 1994) [141]. |
| NorQ | Cytoplasmic. Nucleotide-binding motif. Less clear DNA-binding motif than NirQ. | Identified in P. denitrificans but not well characterised. Mutants have reduced levels of nitrite and nitric oxide reductases (de Boer et al. 1996) [172]. Ps. stutzeri homologue, NirQ, resembles NtrC family of transcriptional activators, mutants have reduced nitrite and nitric oxide reductase activity but similar level of the proteins (Jüngst and Zumft 1992) [171]. |
Four of these regulatory proteins (FnrP, NNR, NosR and Nirl) are known to be involved with the transcription of one or more denitrification genes. NosR mutants in Ps. stutzeri fail to synthesise nitrous oxide reductase [173], whilst NNR mutants in P. denitrificans fail to synthesise the nitrite and nitric oxide reductases [197]. FNR and its close homologues appear to regulate the synthesis of nitrate and nitrous oxide reductases, as well as a number of other genes that are induced under microaerobic conditions [195]. The NirQ protein of Ps. stutzeri seems to be related to the NtrC family of transcriptional regulators [345] in that it contains a nucleotide binding site and a DNA-binding helix-turn-helix motif, but disruption of the nirQ gene gives rise to a mutant in which nitrite and nitric oxide reductases are present at normal or slightly elevated levels but are not active [171]. This suggests some role for NirQ in the modulation of the enzyme activity of these two reductases. The situation is different again for the NirQ homologue found in P. denitrificans, NorQ; disruption of this gene substantially reduces the levels of nitrite and nitric oxide reductases [172]. This may be due to its differing location in the gene cluster; in P. denitrificans norQ lies amongst the structural genes for nitric oxide reductase [172] whereas in Ps. stutzeri it is transcribed divergently upstream of the nirS gene [171].
In P. denitrificans NirI and NNR are the only proteins so far identified as having a role in transcription of the nirS gene and an understanding of their action is far from complete. NirI is predicted to be an integral inner membrane protein with seven transmembrane helices and a putative iron-sulphur cluster [169]. The latter feature may bind a signal molecule, perhaps as part of a redox-sensing pathway. Although its homologue NosR in Ps. stutzeri contains a putative DNA-binding helix-turn-helix motif [173] it is difficult to conceive of a membrane-bound protein acting directly as a transcriptional activator, although such a role has also been suggested for the E. coli FecI protein which is involved in iron dicitrate transport [352] and for the ToxR protein of Vibrio cholerae, which activates the transcription of cholera toxin [353]. Therefore, NirI may be a transcriptional activator or it may be linked to a second as yet unidentified protein which activates transcription from the nirS promoter, in a similar fashion to the two component regulators such as the NarX-NarL system [39]. As the NNR protein probably binds to the nirS NNR-box (although this has not been demonstrated experimentally) an interaction between NirI and NNR cannot be ruled out.
If NirI is involved in transcriptional activation of the nirS gene the role of the NNR box upstream of the nirS gene needs to be clarified. The nirI gene itself could be under the control of NNR as shown in Figure 7.13; due to the palindromic nature of the NNR-binding site the nirS NNR-box could function on the opposite DNA strand to regulate the expression of the divergently-transcribed nirI gene.
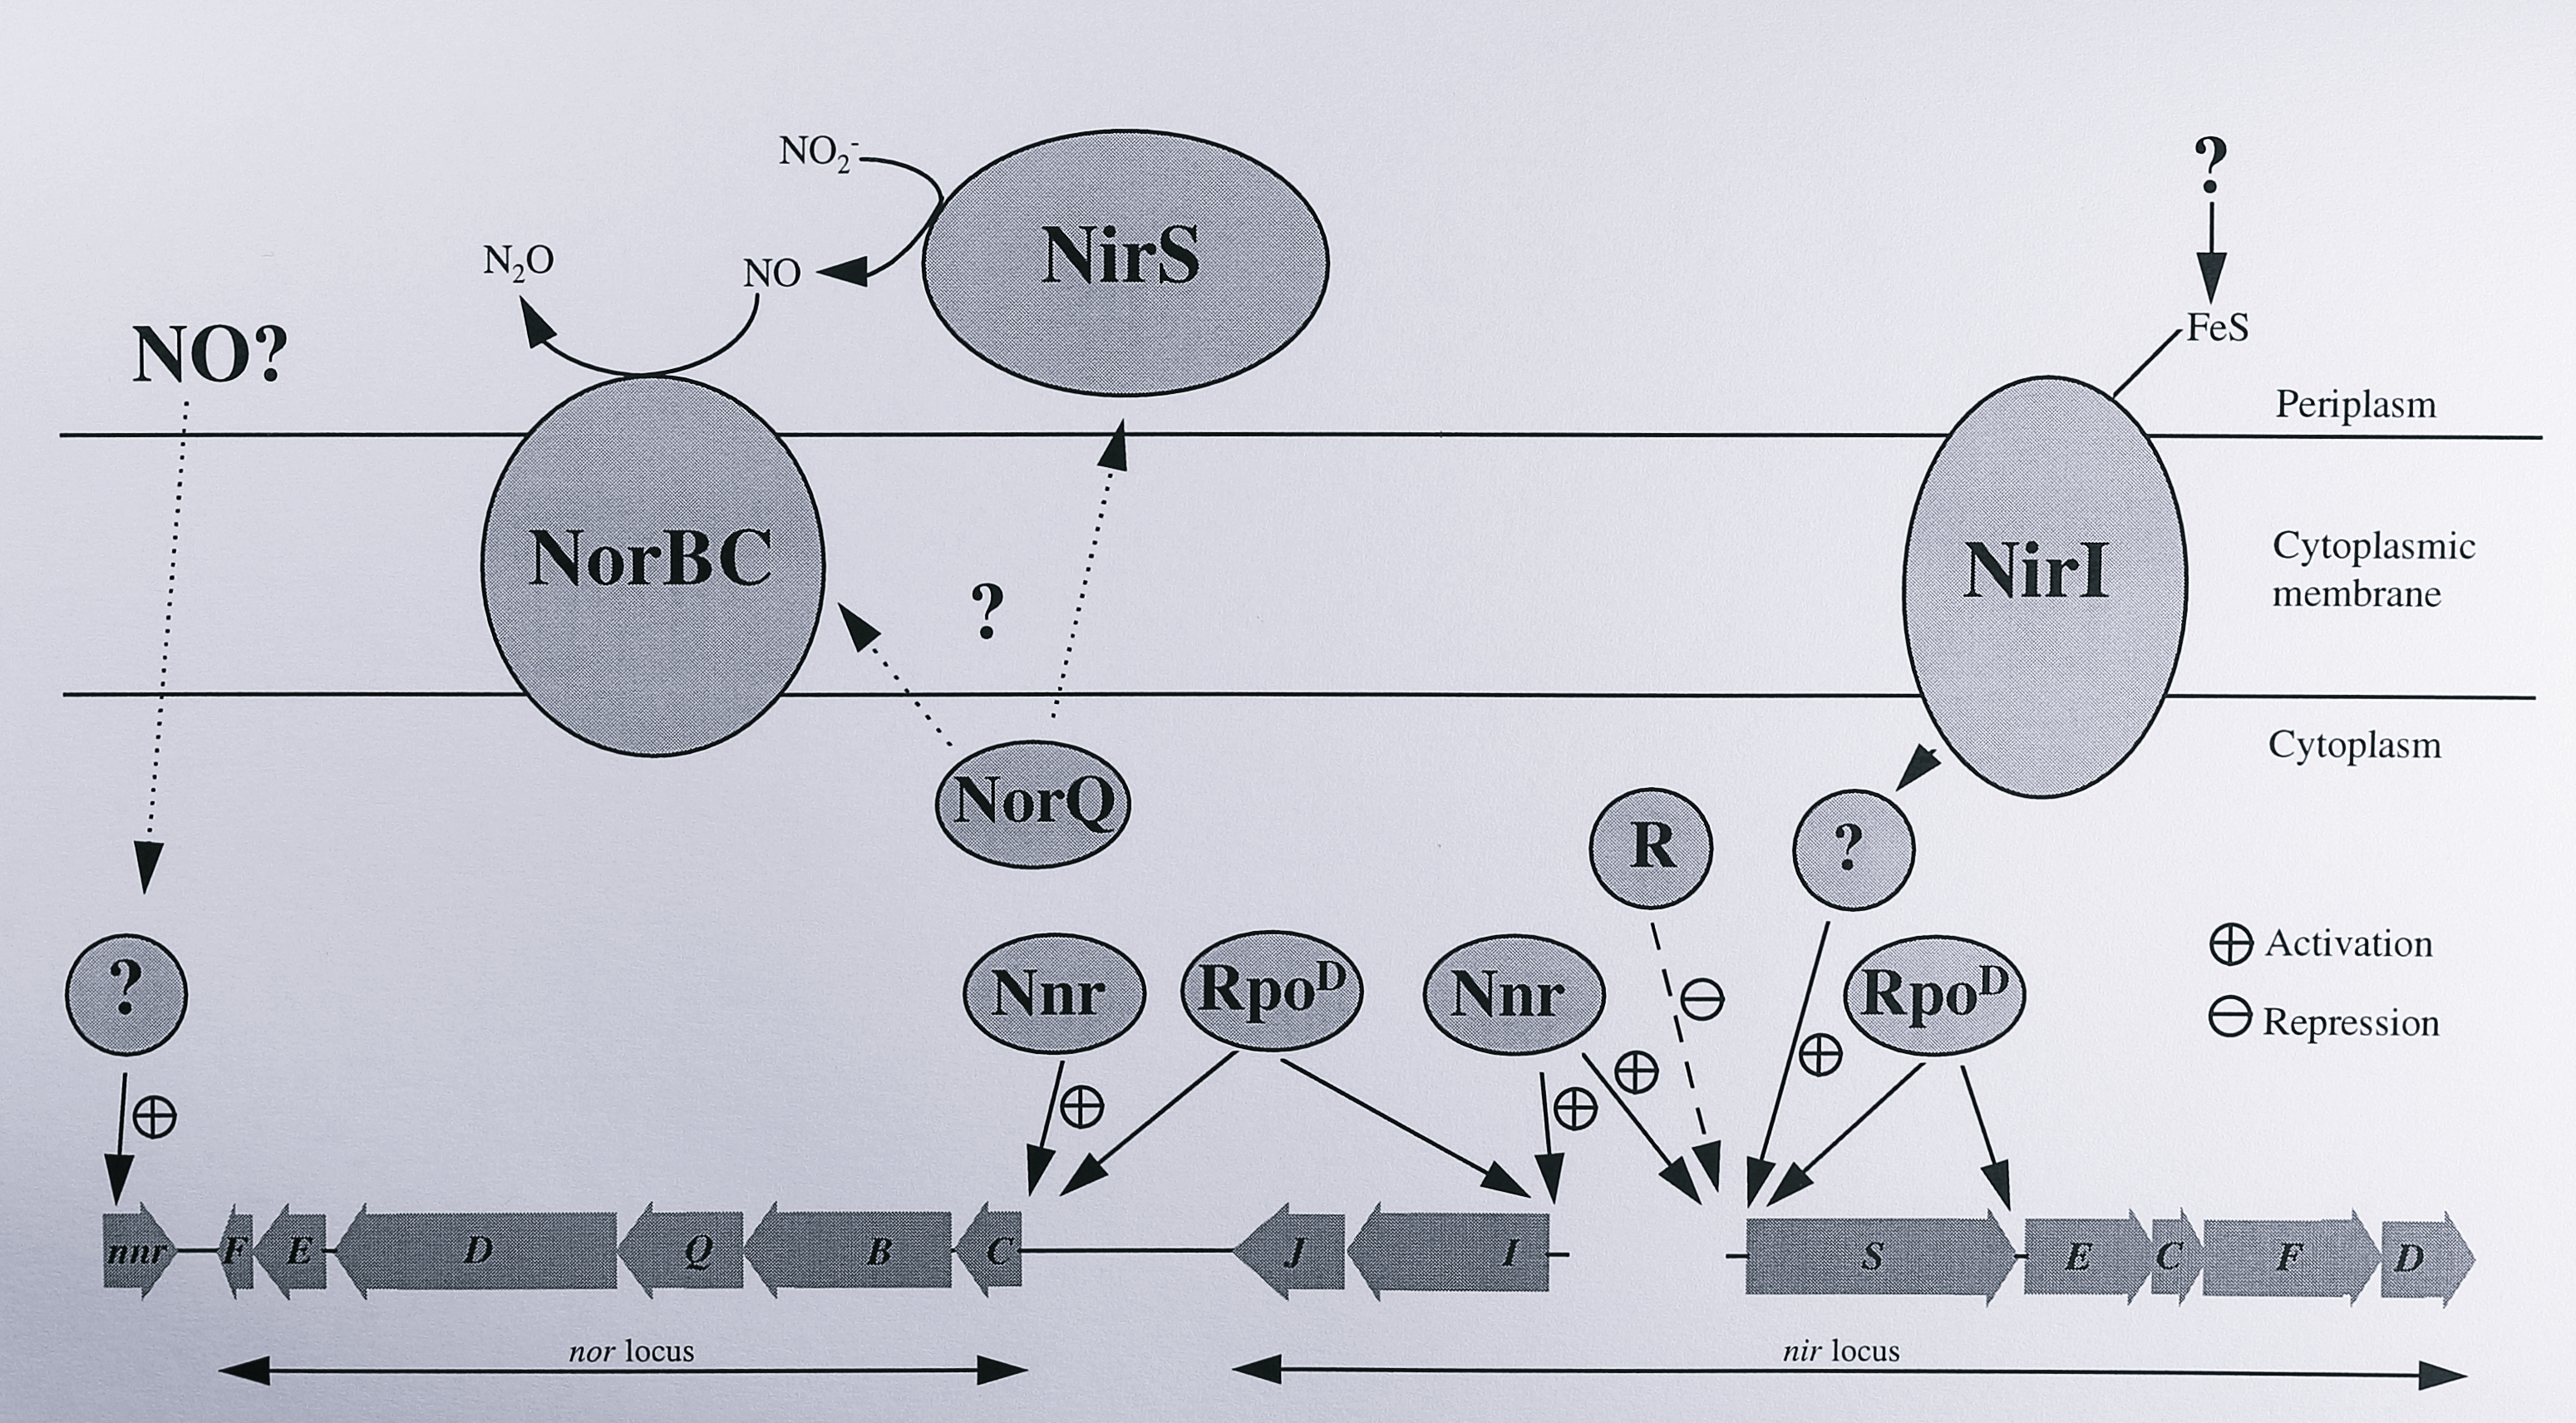
Figure 7.13: Putative factors influencing the transcription of nitrite and nitric oxide reductases in T. pantotropha. In this diagram the Nnr protein is assumed to be a transcriptional activator for the nirS, nirI and norCB genes. The factor(s) that activate transcription of the nnr gene are unknown. NirI also activates transcription of the nirS gene, possibly through an as-yet unidentified cytoplasmic protein. RpoD represents an alternative sigma factor involved in transcription of the denitrification genes; it may not be the same protein in all cases. The circle labelled ‘R’ indicates an as-yet unidentified repressor protein that binds upstream of the nirS gene. The NorQ protein is thought to modulate the activities of the nitrite and nitric oxide reductases; its mode of action is not known. More details are given in the text.
The alignment in Figure 7.12 shows a number of conserved residues in the upstream regions of the nirI and nirS genes suggesting that this is probably the case and strengthening the argument for an interaction between NNR and NirI. Experiments in R. sphaeroides 2.4.3 have shown that the nnrR gene is expressed constitutively at a low level throughout growth and indicate that the Nnr protein is activated by an effector, which has been suggested to be nitric oxide. The initial NO signal would be generated from a low level constitutive activity of the nitrite reductase [204]. In T. pantotropha this is an attractive proposition for two reasons: first, NNR seems to regulate specifically the nitrite and nitric oxide reductases which are involved with the production and consumption of nitric oxide and second, these reductases probably only function at very low oxygen concentrations. As nitric oxide is highly reactive with oxygen, it would be diverted away from bioenergetically-useful reduction by nitric oxide reductase at high oxygen tensions [204]. NirI and NNR might, therefore, function together as a sensor of redox state or of nitric oxide concentration at lower oxygen concentrations than FNR, to co-ordinate the expression of the nitrite and nitric oxide reductases. Two important experiments would clarify the respective roles of NirI and NNR: determination of whether NirI is expressed in an nnr mutant strain and conversely, whether nnr and norCB which are NNR-dependent are expressed in a nirI mutant.
It is clear that much remains to be learned about the mechanisms of regulation during denitrification in P. denitrificans, T. pantotropha and other micro-organisms. It is very likely that further components of the regulatory pathway remain to be discovered and the role of other environmental factors, such as N-oxides remains to be elucidated. For example, it is known that nitrate and nitrite can influence the expression of denitrification genes, most probably through a system similar to the NarX-NarL system of E. coli, although these genes have not yet been discovered in any denitrifying bacterium. In terms of the transcription of the nirS gene in T. pantotropha, a number of future experiments can be suggested. First, it needs to be demonstrated that the nirS and nirE genes each have their own promoter as suggested by the Northern blotting experiments. This should be achieved quite soon using transcriptional or translational fusions with reporter genes downstream of the putative promoter regions. The roles of individual residues in the promoter region can then be investigated further, initially by deletions of whole parts of these regions and ultimately using site-directed mutagenesis. The nature of the RNA polymerase also needs to be elucidated; the T. pantotropha genome should be probed for the presence of one or more copies of an RpoN-like gene and disruption of the gene(s) carried out to determine if this sigma factor is involved in denitrification. Whatever the sigma factor proves to be, the ultimate proof of its function will be to show that in conjunction with NNR it drives transcription in vitro from the nirS promoter. DNA protection studies of the promoter region using NNR and RNA polymerase will eventually show directly the location of the RNA polymerase contact sites and may allow the definition of a consensus binding site for the RNA polymerase.